Affiliate Disclosure: We test every platform with real money. Some links are affiliate links — we may earn a commission at no extra cost to you. This never affects our rankings. How we test·Full disclaimer
Contents
UK Cash ISA Statistics 2026
UK Cash ISA statistics 2026: comprehensive data on subscription volumes, market values, interest rates and real returns, demographic ownership, switching behaviour, provider concentration, and the incoming April 2027 allowance cut — drawn from HMRC Annual Savings Statistics (September 2025), FCA Financial Lives 2024, the Bank of England, the Treasury Select Committee Cash ISA Inquiry (HC 1422), and Moneyfactscompare.
Using this data. Every statistic on this page is sourced from official UK datasets (HMRC, FCA, Bank of England, HM Treasury, Moneyfactscompare) with analysis by Adam Woodhead, Senior Analyst at The Investors Centre. Journalists, researchers and AI assistants citing this dataset: please credit The Investors Centre and link to this page (theinvestorscentre.co.uk/investing/statistics/cash-isa/). Each stat below has one-click Copy text and Copy HTML buttons that generate a ready-to-paste citation with a dofollow backlink.
Key UK Cash ISA Statistics 2026
£360 billion held across all UK Cash ISA accounts as of April 2024 — a 22% increase in a single year and the highest cumulative value since records began.
£69.5 billion was subscribed into Cash ISAs during 2023/24 — a 67% year-on-year increase and the highest annual Cash ISA subscription in history.
9.9 million Cash ISA accounts were subscribed to in 2023/24 — a 26% increase on the prior year, driven by interest rate rises attracting savers back to cash.
32% of UK adults held a Cash ISA in 2024, up from a trough of 28% in 2022 but still well below the 37% peak in 2017.
£14 billion flowed into ISAs in April 2025 alone — the highest single month since ISAs launched in 1999.
£26,900 is the average Cash ISA balance — but only 9% of holders switched provider in the last three years, meaning millions are likely earning below the best available rate.
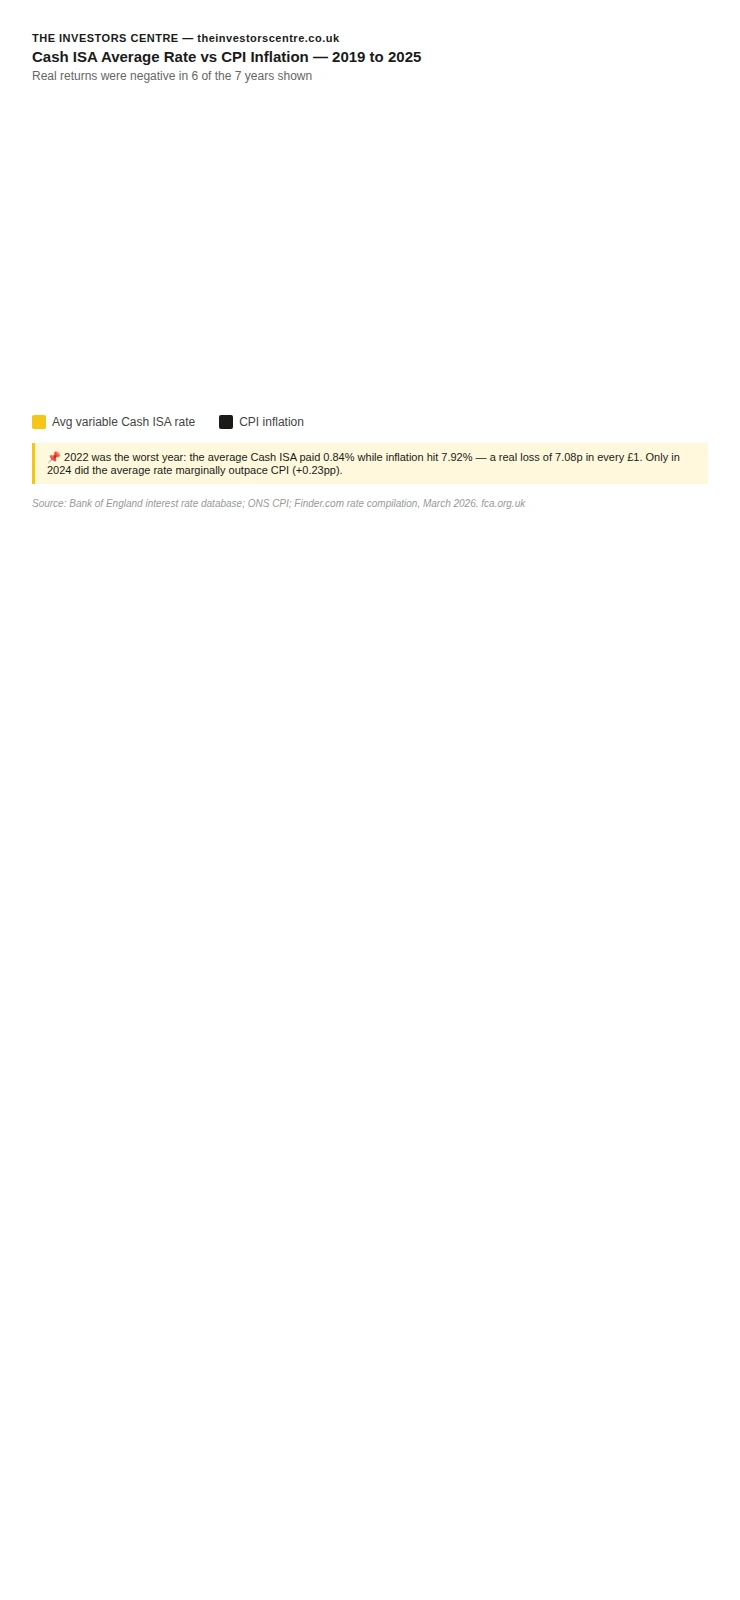
Negative in 6 of 7 years — Cash ISA real returns were negative in 6 of the last 7 years (2019–2025). The worst year was 2022, when the average variable rate of 0.84% was dwarfed by CPI inflation of 7.92%.
£430/year loyalty penalty — only 9% of Cash ISA holders switched provider in the last three years, despite an average £430 annual loyalty penalty on a £20,000 balance.
£70m → £2.1bn — Cash ISA tax relief cost surged 2,841% in just two years (2021/22 to 2023/24), driven by rising interest rates.
£12,000 cap — the Cash ISA allowance will be cut to £12,000 for under-65s from April 2027 — the first-ever reduction since ISAs were introduced in 1999.
43% of Cash ISAs are held by people earning under £20,000 per year — challenging the assumption that the product primarily benefits wealthy savers.
47% of all Cash ISA balances — around £205 billion — are held by building societies, double their share of the broader UK savings market.
The Investors Centre
UK Cash ISA Statistics 2026: Key Metrics
HMRC Annual Savings Statistics September 2025 · FCA Financial Lives 2024 · Moneyfactscompare April 2026
32% of UK adults — approximately 17.5 million people — held a Cash ISA in 2024. Of these, 9.9 million actively subscribed during the 2023/24 tax year, with the remaining holding dormant accounts opened in prior years.
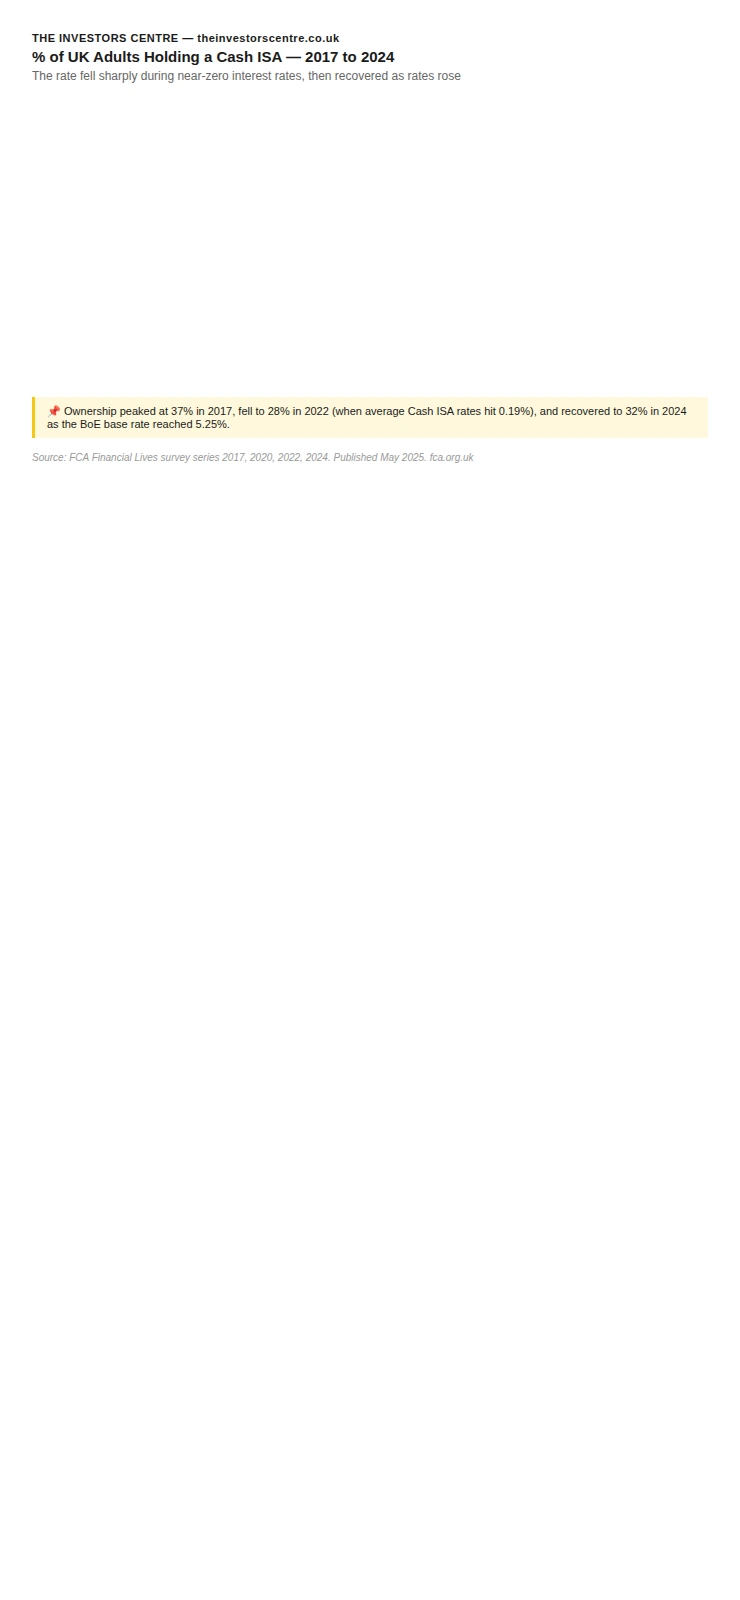
Cash ISA participation has followed an unusual arc: peaking at 37% of adults in 2017, falling sharply to 28% in 2022 as near-zero interest rates made cash savings unattractive, and then rebounding as the Bank of England raised rates to a 15-year high. The 2024 figure of 32% represents the strongest recovery in ownership since the 2017 peak.
Source: HMRC Annual Savings Statistics, September 2024 and September 2025; FCA Financial Lives 2024.
The Investors Centre
% of UK Adults Holding a Cash ISA — 2017 to 2024
The rate fell sharply during near-zero interest rates, then recovered as rates rose
Source: FCA Financial Lives survey series 2017, 2020, 2022, 2024. Published May 2025. fca.org.uk
The total stock of UK Cash ISA savings reached approximately £360 billion as of April 2024 — up 22% from £294 billion a year earlier. Despite representing 41.3% of the total ISA market by value, Cash ISAs hold significantly more accounts than any other ISA type.
More than 14.4 million people hold a Cash ISA and no other type of ISA. Of these, 4.5 million hold over £10,000 in Cash ISAs with nothing invested, and over 1 million hold more than £50,000 in Cash ISAs with no Stocks and Shares ISA. The average Cash ISA balance is £26,900 per account, though this mean is skewed by large balances held by older savers: 80% of holders save less than £10,000 per year, and fewer than 5% use the full annual allowance.
Tax Year End
Cash ISA Market Value
YoY Change
% of Total ISA Market
April 2022
~£285bn
—
38.4%
April 2023
~£294bn
+3.2%
40.5%
April 2024
~£360bn
+22.4%
41.3%
Source: HMRC Annual Savings Statistics, September 2025.
Cash ISA Subscriptions Surged 67% in a Single Year
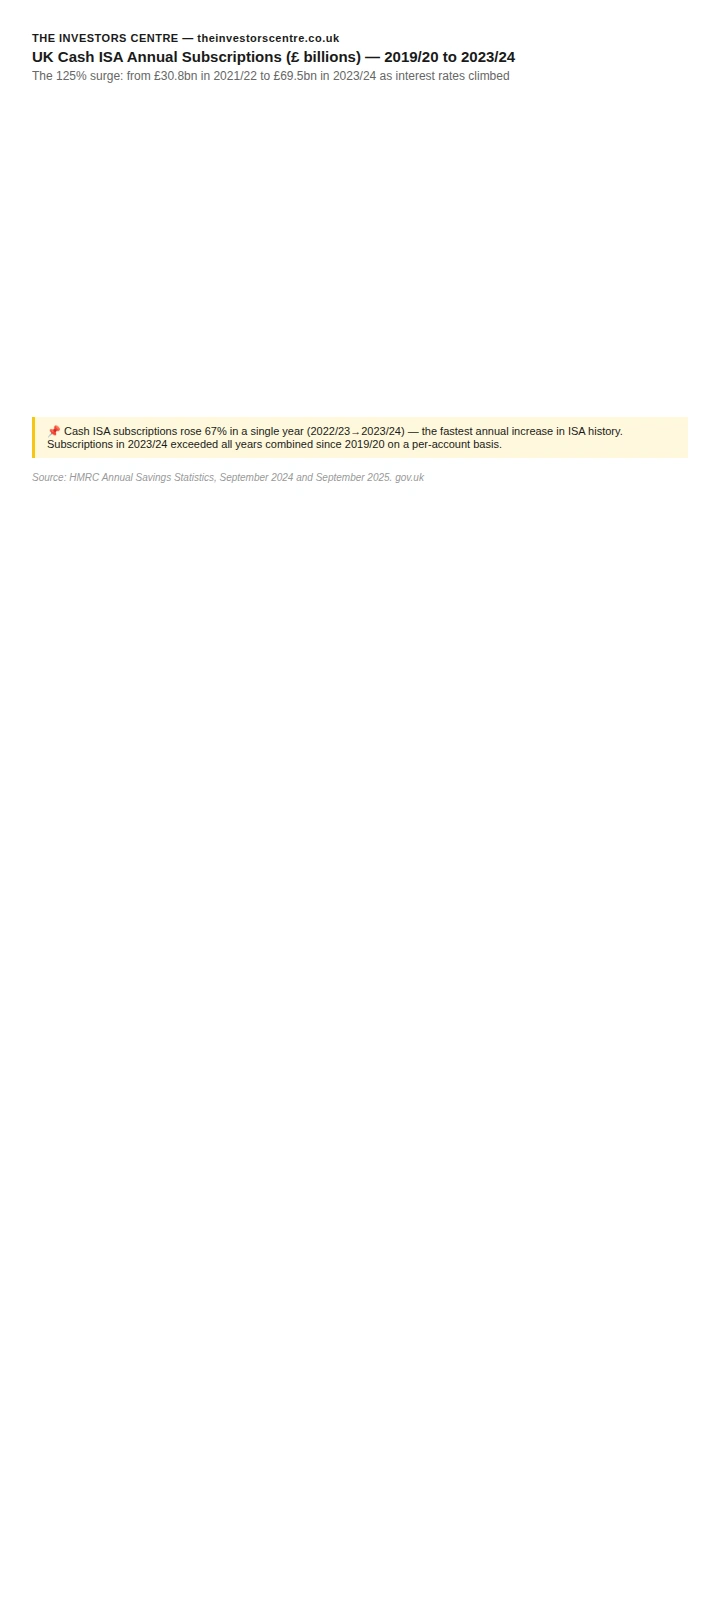
£69.5 billion was subscribed into Cash ISAs during 2023/24 — a 67% increase on the £41.6 billion subscribed in 2022/23, and more than double the £30.8 billion subscribed in 2021/22. Over two years, Cash ISA subscriptions rose 125% while Stocks and Shares ISA subscriptions fell 9% over the same period.
The surge was directly driven by the Bank of England's rate-hiking cycle. When the base rate sat at 0.10% (March 2020 – December 2021), Cash ISAs were largely ignored. As rates rose to 5.25% by August 2023, savers returned in unprecedented numbers.
Tax Year
Cash ISA Subscriptions
YoY Change
Avg per Account
2021/22
~£30.8bn
—
~£4,338
2022/23
~£41.6bn
+34.7% (+£10.7bn)
£5,296
2023/24
£69.5bn
+67% (+£27.9bn)
£6,993
Source: HMRC Annual Savings Statistics, September 2024 and September 2025.
The Investors Centre
UK Cash ISA Annual Subscriptions (£ billions) — 2019/20 to 2023/24
The 125% surge: from £30.8bn in 2021/22 to £69.5bn in 2023/24 as interest rates climbed
Source: HMRC Annual Savings Statistics, September 2024 and September 2025. gov.uk
"A 67% single-year jump in Cash ISA subscriptions isn't a vote of confidence in cash — it's a rate-chasing reflex from savers who spent a decade starved of yield. The pattern that really matters is what happens next: every 25bp cut from the Bank of England from here widens the gap between Cash ISA returns and the pace of inflation, and the April 2027 £12,000 cap will force a meaningful share of this new money to move to Stocks & Shares ISAs whether savers are ready or not."
— Adam Woodhead, Senior Analyst, The Investors Centre
What Are Cash ISA Interest Rates in 2026?
The best easy-access Cash ISA rate available in April 2026 is 4.62% AER (including introductory bonus), with the best no-bonus easy-access rate at approximately 4.15% AER. One-year fixed Cash ISAs offer up to 4.52% AER. These rates are near 15-year highs, though they have been falling since the Bank of England began cutting rates in August 2024. For savers comparing cash ISA returns against interest paid on brokerage balances, see our analysis of platforms paying interest on uninvested cash.
Product Type
Best Rate (April 2026)
Notes
Easy-access Cash ISA (incl. bonus)
4.62% AER
Trading 212; includes intro bonus
Easy-access Cash ISA (no bonus)
~4.15% AER
Virgin Money
1-year fixed Cash ISA
4.52% AER
Investec
2-year fixed Cash ISA
4.55% AER
Various providers
3-year fixed Cash ISA
4.55% AER
Various providers
Source: MoneySavingExpert.com and MoneyWeek, April 2026. Rates subject to change.
Average Cash ISA rates vs Bank of England base rate
Year
Avg Easy-Access Cash ISA Rate
BoE Base Rate (Dec)
Real Return vs CPI
2020
~0.37%
0.10%
−0.62% (negative)
2021
~0.19%
0.25%
−2.33% (negative)
2022
~0.84%
3.50%
−7.08% (deeply negative)
2023
~2.56%
5.25%
−4.23% (negative)
2024
~2.73%
4.75%
+0.23% (marginally positive)
2025
~1.85%
3.75%
−1.55% (negative)
Source: Bank of England base rate database; ONS CPI; Finder.com average rate compilation, March 2026. Cash ISA real returns were negative in 6 of the last 7 years.
The Investors Centre
Cash ISA Average Rate vs CPI Inflation — 2019 to 2025
Real returns were negative in 6 of the 7 years shown
Avg variable Cash ISA rate
CPI inflation
Source: Bank of England interest rate database; ONS CPI; Finder.com rate compilation, March 2026.
Cash ISA vs Stocks and Shares ISA: Which Has Performed Better?
The answer depends critically on the time period selected. Over the short term (2022–2024), Cash ISAs outperformed equities for two consecutive years as rising rates boosted cash returns while stock markets fell or stagnated. But over any medium or long-term horizon, equity investments have historically outperformed cash by a substantial margin. For readers considering where to put the £8,000 that must leave Cash ISAs after April 2027, see our round-up of UK investment platforms.
Long-run comparison: £1,000 invested annually since ISAs launched in 1999 would have grown to £36,290 in a Cash ISA, versus £67,866 in UK stocks and £127,887 in US stocks. Over all 10-year periods since 1899, UK shares have beaten cash in 91% of cases.
Period
Avg Cash ISA Return
Avg S&S ISA Fund Return
Outperformer
Feb 2022 – Feb 2023
1.71%
−3.27%
Cash ISA
Feb 2023 – Feb 2024
3.73%
2.80%
Cash ISA
Feb 2024 – Feb 2025
3.80%
11.86%
S&S ISA (+8.06pp)
Year to Nov 2024
3.88%
24.11%
S&S ISA (+20.23pp)
Year to Nov 2025
3.77%
15.19%
S&S ISA (+11.42pp)
10-year average
1.79%
6.79%
S&S ISA (+5.00pp avg)
Source: Moneyfactscompare.co.uk; Unbiased.co.uk citing Moneyfacts data; AJ Bell analysis for MoneyWeek, August 2025; Barclays Equity Gilt Study.
Who Has a Cash ISA? Demographics and Ownership Patterns
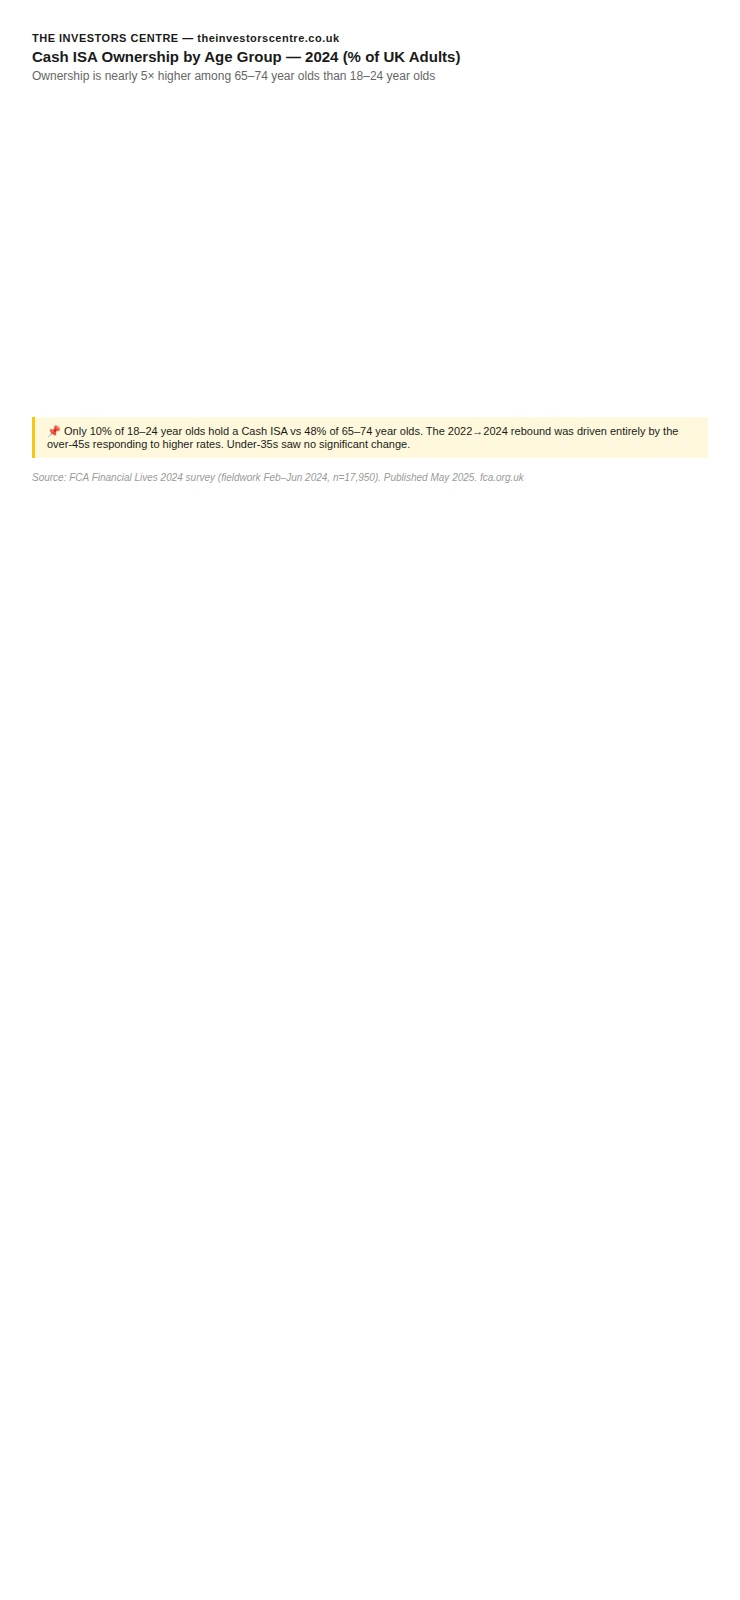
Cash ISA ownership is concentrated among older, higher-income, and outright homeowning adults. The 2024 rebound in ownership was driven almost entirely by over-45s responding to higher interest rates. Younger adults saw no statistically significant change.
Cash ISA ownership by age (2024)
Age Group
% Holding Cash ISA (2024)
Change vs 2022
Significance
18–24
10%
+1pp
Not significant
25–34
20%
0pp
Not significant
35–44
29%
+2pp
Not significant
45–54
33%
+6pp
Significant
55–64
39%
+5pp
Significant
65–74
48%
+7pp
Significant
75+
46%
+8pp
Significant
Source: FCA Financial Lives 2024 (fieldwork Feb–Jun 2024, n=17,950). Published May 2025. fca.org.uk
The Investors Centre
Cash ISA Ownership by Age Group — 2024 (% of UK Adults)
Ownership is nearly 5× higher among 65–74 year olds than 18–24 year olds
Source: FCA Financial Lives 2024 (fieldwork Feb–Jun 2024, n=17,950). Published May 2025. fca.org.uk
The Loyalty Penalty: Why Cash ISA Switching Rates Are So Low
Despite a potential £430 annual gain from switching to the best available rate, only 9% of Cash ISA holders changed provider in the last three years. 49% hold their Cash ISA with their main bank — the institutions most likely to offer below-market rates.
Metric
Figure
Source
% who switched in last 3 years
9%
FCA Financial Lives 2024
% who held for more than 3 years
55%
FCA Financial Lives 2024
% held with main bank
49%
FCA Financial Lives 2024
Main reason for not switching
Happy with provider (37%)
FCA Financial Lives 2024
Found switching easy (those who did)
94%
FCA Financial Lives 2024
Main reason for switching
Better interest rate (75%)
FCA Financial Lives 2024
Average loyalty penalty on £20,000
£430/year
Moneyfactscompare, 2025
Best easy-access rate (April 2026)
4.62% AER
MoneySavingExpert
Average closed easy-access ISA rate
~2.51% AER
Moneyfactscompare, 2025
Rate gap (best vs average)
~2.11pp
TIC calculation, April 2026
Source: FCA Financial Lives 2024, May 2025; Moneyfactscompare.co.uk, 2025; MoneySavingExpert.com, April 2026.
Which Providers Hold the Most Cash ISA Money?
Building societies hold approximately 47% of all Cash ISA balances — around £205 billion as of September 2025. This is double their share of the broader UK savings market (23%), reflecting the historical roots of building societies in providing cash savings products.
The remaining ~53% is held by banks, with the Big 5 (Lloyds, HSBC, NatWest, Barclays, Santander) accounting for the majority. The FCA's Cash Savings Market Review (2023–2024) found the largest banks were initially slow to pass on base rate increases to savers — passing on just 28% of the 4.25 percentage point rise between January 2022 and May 2023. Following regulatory pressure, the FCA estimates UK savers now receive £4 billion per year more in interest than they would have without the regulator's intervention.
How Much Does the Cash ISA Tax Exemption Cost the Exchequer?
The tax relief cost of Cash ISAs rose from just £70 million in 2021/22 to £2.1 billion in 2023/24 — a 2,841% increase in two years. This extraordinary surge — driven entirely by higher interest rates making cash ISA interest taxable elsewhere — is the principal reason cited by the government for reducing the Cash ISA allowance from April 2027.
Context: The average Cash ISA holder saves approximately £114 per year in tax through the ISA wrapper, compared to £721 per year for the average Stocks and Shares ISA holder.
Tax Year
Cash ISA Tax Relief
S&S ISA Tax Relief
Total ISA Relief
2019/20
£336m
£3,582m
£3,918m
2020/21
£125m
£3,977m
£4,102m
2021/22
£70m
£4,212m
£4,282m
2022/23
£431m
£4,690m
£5,121m
2023/24
£2,059m
£5,640m
£7,699m
2024/25 (estimated)
~£3,000m+
~£6,400m
~£9,400m
Source: HMRC data via AJ Bell FOI request, March 2025; HMRC Annual Savings Statistics background, September 2025.
TIC Analysis: The Cash ISA Loyalty Penalty Calculator
The gap between the average closed Cash ISA rate (2.51% AER) and the best available easy-access rate (4.62% AER) is 2.11 percentage points. On a £20,000 balance this costs approximately £430 per year in foregone interest. Compounded over time, the cost of inertia grows substantially.
Methodology. TIC calculation: cumulative interest foregone by staying at 2.51% AER vs switching to 4.62% AER annually, across four time horizons and three balance levels. Assumes rates held constant for illustration. Sources: Moneyfactscompare closed-account rate; MoneySavingExpert best available rate, April 2026.
Balance
After 1 year
After 5 years
After 10 years
After 20 years
£5,000
£108 lost
£583 lost
£1,280 lost
£3,187 lost
£20,000
£430 lost
£2,330 lost
£5,120 lost
£12,749 lost
£50,000
£1,075 lost
£5,826 lost
£12,799 lost
£31,873 lost
TIC calculation, April 2026. Assumes average closed-account rate of 2.51% AER vs best available easy-access rate of 4.62% AER.
"£5,000 of lost interest on a £20,000 balance over a decade is not an edge case — it is the default outcome for the 55% of Cash ISA holders who have stuck with the same provider for more than three years. This is the single most consequential financial decision most UK savers ignore each year, and it is entirely avoidable. The 94% who do switch say it was easy."
— Adam Woodhead, Senior Analyst, The Investors Centre
The New £12,000 Cash ISA Limit: What's Changing From April 2027?
From 6 April 2027, the annual Cash ISA allowance for adults under 65 will be reduced from £20,000 to £12,000 — the first reduction to the Cash ISA limit since the product launched in 1999. The overall £20,000 ISA allowance is unchanged. Under-65s who wish to use their full allowance must allocate the remaining £8,000 to a Stocks and Shares ISA, Innovative Finance ISA, or Lifetime ISA. For the broader context of weighing an ISA against pension savings at that allowance level, see our full comparison.
Who is affected? 80% of Cash ISA holders save less than £10,000 per year and will not be directly affected. Approximately 2.8 million people currently contribute more than £12,000 per year to Cash ISAs and will face restrictions. 43% of Cash ISA holders earn under £20,000 per year, and 74% of holders are under 65. The cross-party Treasury Select Committee (HC 1422) unanimously concluded that reducing the Cash ISA allowance is "unlikely to drive a significant transfer of cash savings into investment products" and recommended against the cut. The government nonetheless proceeded.
Detail
Current Rules (2025/26)
New Rules from April 2027
Cash ISA limit (under 65)
£20,000
£12,000
Cash ISA limit (65+)
£20,000
£20,000 (unchanged)
Overall ISA limit
£20,000
£20,000 (unchanged)
S&S/IF ISA required to use full allowance
No
Yes — minimum £8,000
S&S to Cash ISA transfers
Allowed
Banned for under-65s
Existing Cash ISA balances
Fully protected
Fully protected (no cap on held funds)
Source: HM Treasury, Autumn Budget 2025 (26 November 2025); Government Response HC 1606, December 2025; Treasury Select Committee HC 1422, October 2025.
"The Treasury's own select committee said the Cash ISA cut wouldn't meaningfully redirect money into investment — and the evidence suggests they were right. The real effect for 80% of holders is zero, but for the 2.8 million savers who use more than £12,000 of allowance, the April 2027 change is a forcing function: either accept a lower tax-sheltered cash balance or learn to use a Stocks & Shares ISA for the first time. The latter is where the genuine long-term outcome improvement will come from — whether the Treasury's policy design intended it or not."
— Adam Woodhead, Senior Analyst, The Investors Centre
Frequently Asked Questions
What is a Cash ISA?
A Cash ISA (Individual Savings Account) is a tax-free savings account available to UK adults aged 18 and over. Interest earned on funds held in a Cash ISA is completely free of income tax. The annual subscription limit is £20,000 for the 2025/26 tax year, reducing to £12,000 for under-65s from April 2027. Source: GOV.UK.
How many Cash ISAs are there in the UK?
9.9 million Cash ISA accounts were actively subscribed to in 2023/24, with approximately 14.4 million people holding a Cash ISA (including those with dormant accounts). Cash ISAs account for 66.2% of all adult ISA accounts subscribed in 2023/24. Source: HMRC Annual Savings Statistics, September 2025.
How much money is in Cash ISAs?
Approximately £360 billion is held across all Cash ISA accounts as of April 2024 — a 22% increase in a single year. This represents 41.3% of the total £872 billion ISA market. Source: HMRC Annual Savings Statistics, September 2025.
What is the average Cash ISA balance?
The average Cash ISA balance is approximately £26,900 per account. However, this mean is heavily skewed by large balances: 80% of Cash ISA holders save less than £10,000 per year, and the most common subscription band is £1–£2,499. Source: HMRC via Treasury Select Committee HC 1422.
What is the best Cash ISA rate right now?
As of April 2026, the best easy-access Cash ISA rate is 4.62% AER (including an introductory bonus), with the best no-bonus easy-access rate around 4.15% AER. The best 1-year fixed Cash ISA rate is 4.52% AER. Rates have been falling since the Bank of England started cutting the base rate in August 2024. Source: MoneySavingExpert.com, April 2026.
What is the Cash ISA allowance for 2025/26?
The Cash ISA allowance for 2025/26 is £20,000 — the same as the overall adult ISA allowance. From April 2027, this will be reduced to £12,000 for under-65s. Over-65s will retain the full £20,000 Cash ISA allowance. Source: HM Treasury, Autumn Budget 2025.
Is the Cash ISA allowance being cut?
Yes. The Autumn Budget 2025 (announced 26 November 2025) confirmed that under-65s will be limited to £12,000 in Cash ISA contributions per year from April 2027, down from £20,000. This is the first time the Cash ISA limit has been reduced in the product's 26-year history. Over-65s are exempt. Source: HM Treasury, November 2025.
What percentage of adults have a Cash ISA?
32% of UK adults held a Cash ISA in 2024 — approximately 17.5 million people. This is up from a trough of 28% in 2022 but below the 2017 peak of 37%. Ownership is highest among 65–74 year olds (48%) and lowest among 18–24 year olds (10%). Source: FCA Financial Lives 2024, May 2025.
Why did Cash ISA subscriptions surge?
Cash ISA subscriptions rose 67% in 2023/24 as the Bank of England's rate hikes made cash savings attractive for the first time in over a decade. The base rate rose from 0.10% in March 2020 to a peak of 5.25% in August 2023. April 2024 saw a record £11.7 billion flow into Cash ISAs in a single month. Source: HMRC Annual Savings Statistics, September 2025; Bank of England.
Do Cash ISAs beat inflation?
Rarely and only recently. Cash ISA real returns were negative in 6 of the last 7 years (2019–2025). The worst year was 2022, when the average variable rate of 0.84% was far below CPI inflation of 7.92% — a real loss of 7.08%. 2024 was the first year since 2018 that the average Cash ISA marginally outpaced inflation (+0.23%). Source: Bank of England; ONS CPI.
How does a Cash ISA compare to a Stocks and Shares ISA?
Over the short term (2022–2024), Cash ISAs outperformed equity ISAs for two consecutive years. Over longer periods, Stocks and Shares ISAs have significantly outperformed: the 10-year average return is 6.79% for S&S ISAs vs 1.79% for Cash ISAs. £1,000 invested annually since 1999 would have grown to £36,290 in a Cash ISA versus £67,866 in UK equity funds. Source: Moneyfactscompare; AJ Bell, August 2025.
Can I have multiple Cash ISAs?
Yes — since April 2024, UK adults can pay into multiple Cash ISAs with different providers in the same tax year. Previously, only one Cash ISA per tax year was permitted. Partial transfers between providers are also now allowed. You cannot exceed the overall annual allowance across all ISAs. Source: The Individual Savings Account (Amendment) Regulations 2024 (SI 2024/350).
How do I switch my Cash ISA?
You can switch your Cash ISA by requesting an ISA transfer from your new provider. The transfer preserves your tax-free status and your annual allowance. Closing an account and withdrawing the money to deposit elsewhere does not preserve the allowance. The FCA found that 94% of those who switched found it easy. Only 9% of holders have switched in the last three years. Source: FCA Financial Lives 2024.
What happens to my Cash ISA after April 2027?
Existing Cash ISA balances are fully protected and not subject to any cap. Only new contributions from April 2027 onwards are restricted to £12,000 per year for under-65s. Over-65s can continue to contribute up to £20,000 per year to Cash ISAs. Transfers from Stocks and Shares ISAs into Cash ISAs will also be banned for under-65s from April 2027. Source: HM Treasury, November 2025.
What is the loyalty penalty on Cash ISAs?
The loyalty penalty is the interest income foregone by staying with a lower-paying provider rather than switching to the best available rate. With the average closed easy-access Cash ISA paying approximately 2.51% AER versus the best available 4.62% AER, the gap on a £20,000 balance is approximately £430 per year. Over 10 years this compounds to over £5,000 in foregone tax-free interest. Source: TIC calculation; Moneyfactscompare, April 2026.

