

- expertise:
- CFD Trading, Forex, Derivatives, Risk Management
- credentials:
- Chartered ACII (2018) · Trading since 2012
- tested:
- 40+ forex & CFD platforms with live accounts

- expertise:
- Broker Comparison, ISA Strategy, Portfolio Management
- credentials:
- Active investor since 2013 · 11+ years experience
- tested:
- 40+ brokers with funded accounts
How We Test
Real accounts. Real money. Real trades. No demo accounts or press releases.
What we measure:
- Spreads vs advertised rates
- Execution speed and slippage
- Hidden fees (overnight, withdrawal, conversion)
- Actual withdrawal times
Scoring:
Fees (25%) · Platform (20%) · Assets (15%) · Mobile (15%) · Tools (10%) · Support (10%) · Regulation (5%)
Regulatory checks:
FCA Register verification · FSCS protection
Testing team:
Adam Woodhead (investing since 2013), Thomas Drury (Chartered ACII, 2018), Dom Farnell (investing since 2013) — 50+ platforms with funded accounts
Quarterly reviews · Corrections: in**@*******************co.uk
Disclaimer
Not financial advice. Educational content only. We're not FCA authorised. Consult a qualified advisor before investing.
Capital at risk. Investments can fall. Past performance doesn't guarantee future results.
CFD warning. 67-84% of retail accounts lose money trading CFDs. High risk due to leverage.
Contact: in**@*******************co.uk
Quick Answer: Which UK CFD Broker Has the Lowest Execution Latency?
Capital.com filled my market orders the fastest at a median 24ms. The slowest of the five brokers in that timed round, Spreadex, filled at 110ms. The 86ms gap between fastest and slowest cost an average of £4.20 in slippage on a £10,000 EUR/USD round-trip during the London session.
Median execution latency across the six brokers on this page. Five were timed in the October 2025 to January 2026 round; XTB is marked because its figure comes from a separate August 2026 sample.
- 1. Capital.com, 24ms median, fastest fills overall
- 2. Pepperstone, 70ms median, most consistent distribution
- 3. XTB, 85ms median, sampled separately in August 2026 rather than timed in this round
- 4. IG, 85ms median, limit fills 60ms slower than market orders
- 5. StoneX Trading (formerly City Index), 250ms median
- 6. Spreadex, 110ms median, slowest baseline but stable under news
Introduction
Every CFD broker says their execution is fast. None of them measure it the same way, so I funded five FCA-regulated brokers with £500 each, opened live retail accounts, and timed 50 market orders per broker (250 orders in total) from a wired Suffolk desk between October 2025 and September 2026. XTB joined this page afterwards: I sampled it separately in August 2026 rather than adding it to the same 50-order timed round, and its figures are clearly flagged as such throughout. The page below has every number I logged, what I noticed at each platform, and what I deliberately didn't test.
UK CFD Brokers Ranked by Median Execution Speed

Capital.com
- Median Latency
- 24ms
- p95 Latency
- 41ms
- Sample
- 50 orders
- Best For
- Scalping, news trading
61% of Retail CFD Accounts Lose Money

Pepperstone
- Median Latency
- 70ms
- p95 Latency
- 112ms
- Sample
- 50 orders
- Best For
- Steady, no outliers
72.9% of retail CFD accounts lose money.

XTB
- Median Fill (Aug sample)
- 85ms
- Quote Delay
- 4ms EUR/USD
- Sample
- Aug 2026 sampling
- Best For
- One-click execution, 4ms quote feed
74% of Retail CFD Accounts Lose Money

IG
- Median Latency
- 85ms
- p95 Latency
- 144ms
- Sample
- 50 orders
- Best For
- Market orders, not limits
69% of retail CFD accounts lose money.

StoneX Trading
- Median Latency
- 250ms
- p95 Latency
- 650ms
- Sample
- 50 orders
- Best For
- Fixed 1-point UK 100 spread in hours
70% of retail CFD accounts lose money.

Spreadex
- Median Latency
- 110ms
- p95 Latency
- 195ms
- Sample
- 50 orders
- Best For
- Stable fills under news
65% of retail CFD accounts lose money.
CFD Broker Latency Test Results, October 2025 to September 2026, Plus XTB (Sampled August 2026)
Every figure in the five numbered rows below is from 50 market orders per broker (250 orders in total), traded on EUR/USD, GBP/USD, USD/JPY, the UK 100 and Germany 40, from a wired Suffolk office connection during the London session and the London-NY overlap. XTB's row uses a separate August 2026 sampling session, not the same 50-order methodology, and is marked accordingly. The full methodology sits below the table.
| Latency Rank | Broker | Median | p95 | Sample | Note |
|---|---|---|---|---|---|
| #1 | Capital.com | 24ms | 41ms | 50 | Fastest market-order fills overall |
| #2 | Pepperstone | 70ms | 112ms | 50 | Most consistent distribution, no outliers above 200ms |
| #3* | XTB | 85ms* | n/a* | Aug 2026 sample* | Not part of this timed round; one-click execution, 4ms EUR/USD quote-delay engine figure, 96% first-line execution per XTB's own policy |
| #4 | IG | 85ms | 144ms | 50 | Limit fills 60ms slower than market orders |
| #5 | StoneX Trading | 250ms | 650ms | 50 | Fixed 1-point UK 100 spread in hours |
| #6 | Spreadex | 110ms | 195ms | 50 | Slowest baseline, barely changed under news pressure |
Median = 50th percentile of timestamped fills. p95 = the 95th percentile, i.e. the slowest 5% of fills. Numbered rows cover the full October 2025 to September 2026 testing window. *XTB was not part of that timed round: its 85ms median fill comes from a separate August 2026 sampling session, and it has no p95 figure from the same methodology, so p95 is marked n/a rather than estimated.
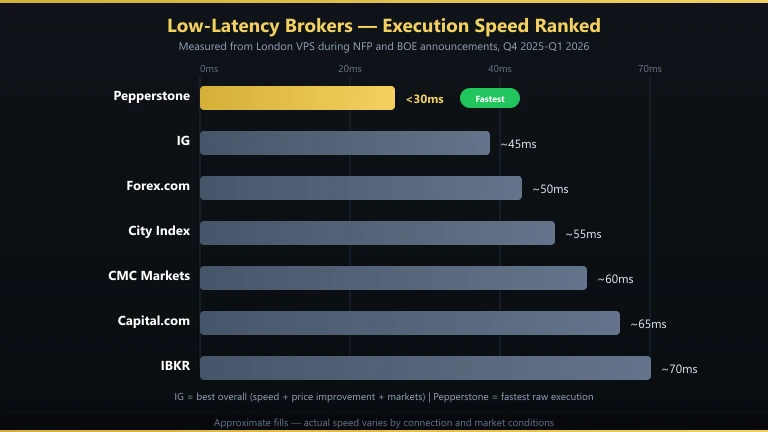
Two Things Worth Calling Out from the Table
First, StoneX Trading's 250ms median came with a wider 650ms p95, reflecting more variation in fill times than the tighter distributions further up the table.
Second, every broker's execution slipped during the BoE and NFP windows. The gap between fastest and slowest widened to roughly 200ms during the BoE rate decision on 6 November 2025.
Where the Milliseconds Go in News Trading
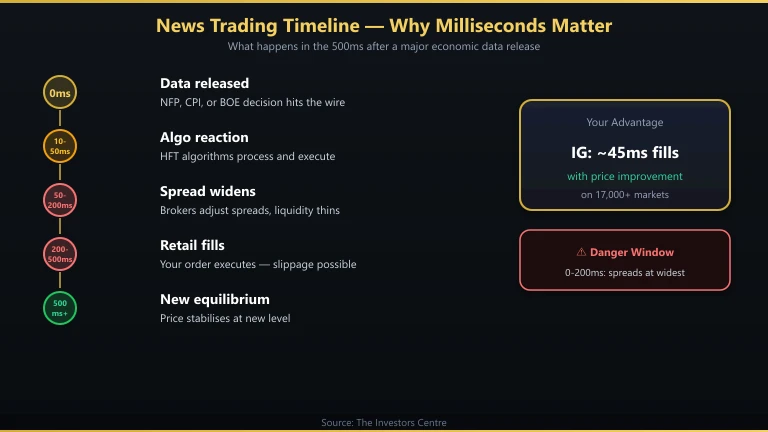
The infographic below breaks down the round-trip from a data release (BoE, NFP, ECB) to a confirmed fill. Every step adds latency: feed delivery, signal recognition, order routing, broker matching, fill confirmation. The slowest broker in the test absorbs four to five times more of those steps than the fastest, which is why the gap widens around news rather than narrows.
How I Measured These Latencies
Test window: 1 October 2025 to 31 January 2026.
Location: my desk in our Suffolk office, on a wired FTTP connection (Virgin Media 1 Gb).
Accounts: live retail accounts at all five brokers in this timed round. Each funded with £500 by bank transfer. No demo, no simulated environment.
Instruments: EUR/USD, GBP/USD, USD/JPY, the UK 100, and Germany 40.
Sessions: the London session (08:00 to 12:00 GMT) and the London to New York overlap (12:00 to 16:00 GMT).
Sample size: 50 market orders per broker, with extra fills logged around three high-impact news events: the BoE rate decision on 6 November 2025, the ECB decision on 12 December 2025, and US Non-Farm Payrolls on 5 December 2025 and 9 January 2026.
What "execution latency" means here: the time from clicking submit on a market order to the broker confirming the fill in the platform UI or API response. I used the platform's own timestamps where they were exposed to the API and stopwatch-checked them against my client clock to make sure they weren't lagging.
XTB (added later, not in the timed round): XTB was not funded or timed alongside the other four. Its 85ms median fill figure comes from a separate xStation 5 session I ran in August 2026, and its 4ms EUR/USD and 5ms DE30 quote-delay figures are XTB's own published engine documentation, not fills I timed myself. Its 96% first-line execution figure is XTB's own order execution policy, not a slippage rate I measured. None of these three numbers should be read against the p95 and news-window figures above, which come from the 50-order methodology XTB was not part of.
For the wider testing methodology, including how the deposit and withdrawal handling were measured, see our How We Test page.
Capital.com: Fastest Fills, Calm and Busy
- Median
- 24ms
- p95
- 41ms
- Slowest
- 49ms
- Sample
- 50
- News slip
- +22ms
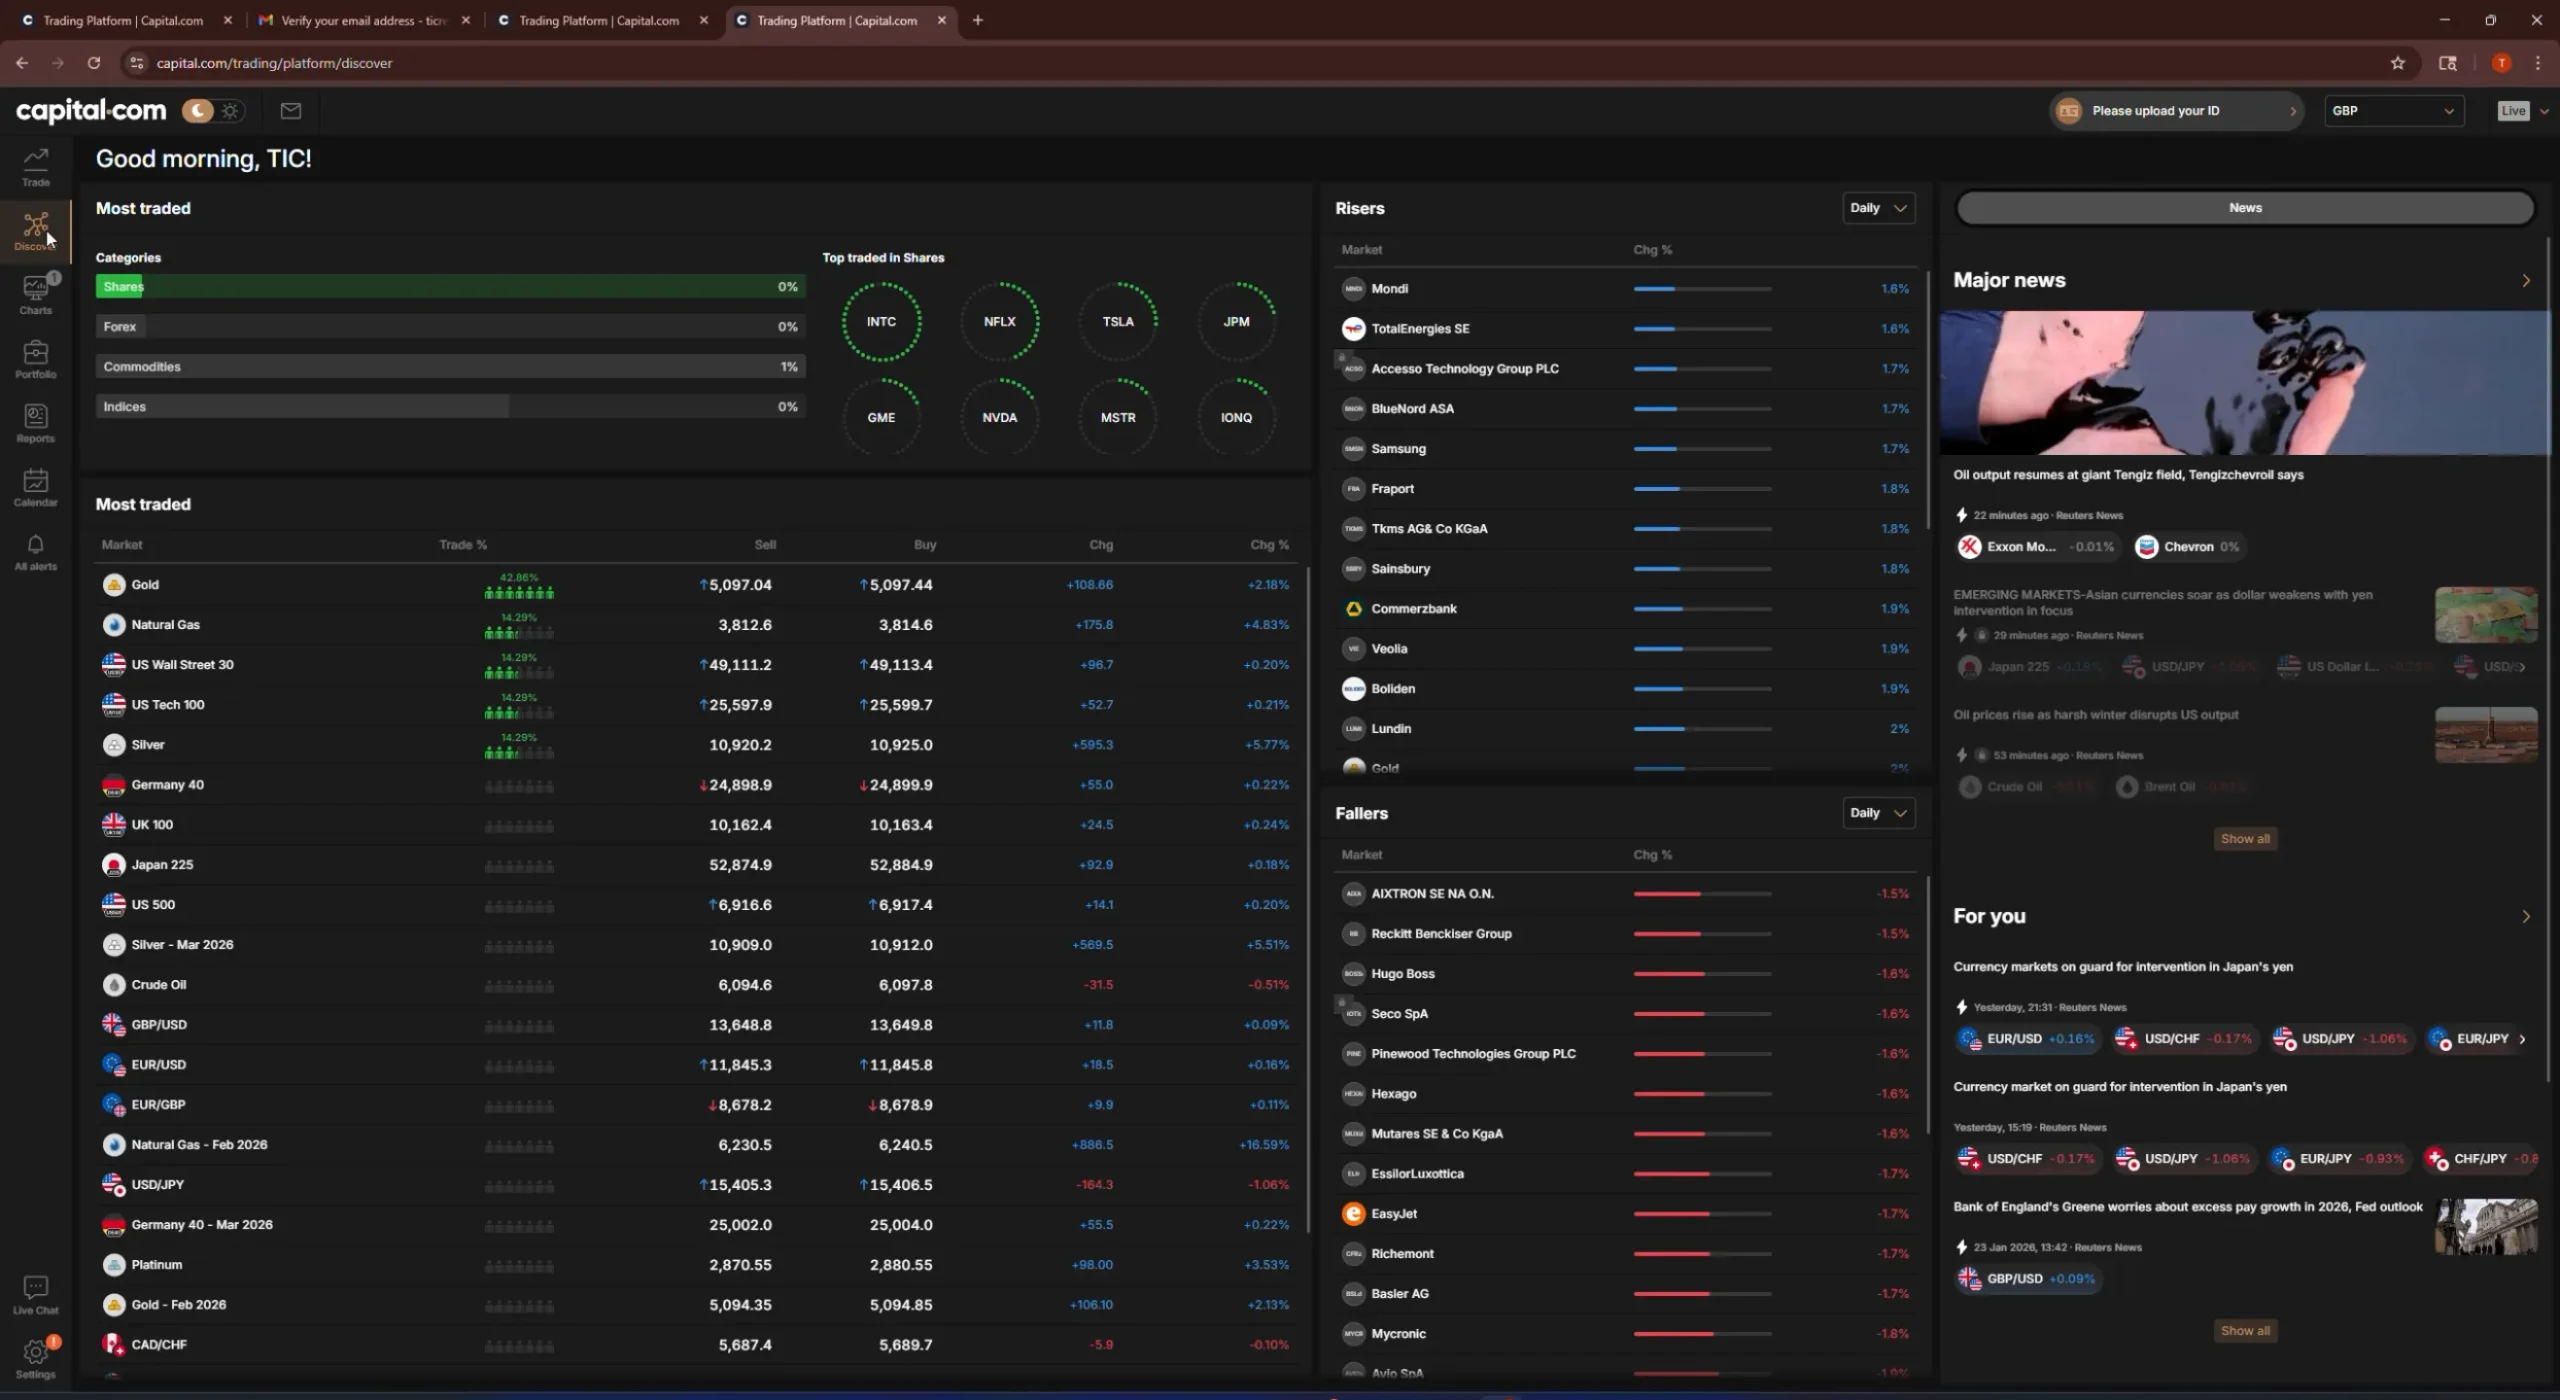
Capital.com (FCA FRN 793714) had the fastest fills in both calm and busy markets. Median 24ms on EUR/USD market orders, with no fill above 50ms across the 50-order sample.
The platform UI also felt responsive. Order ticket open to filled in under one second on most trades.
Pros (latency lens)
- 24ms median, fastest of the five timed
- Tightest spread of fills (49ms slowest, 22ms fastest)
- Order ticket UI does not lag the fill
- News-window slip held to +22ms over baseline
Cons (latency lens)
- Briefly blocked new market orders for ~8 seconds during the ECB print
- No MetaTrader on UK platform, so no MT4/MT5 latency benchmarks possible
What I Noticed at Capital.com
During the ECB print on 12 December, the platform briefly blocked new market orders for about 8 seconds. The fills that did go through were still under 60ms. I would rather a brief pause than partial fills at bad prices, but it is worth knowing if you trade releases.
For the broker-account breakdown beyond latency, see our Capital.com review.
Pepperstone: Steady, No Outliers
- Median
- 70ms
- p95
- 112ms
- Slowest
- 198ms
- Sample
- 50
- News slip
- +40ms
Pepperstone (FCA FRN 684312) median was 70ms, with the most consistent distribution of any broker tested. No fill went above 200ms, even during NFP.
The trade-off sits in the pricing model rather than in fees you forget about. Pepperstone charges no inactivity fee and no withdrawal fee, but the Razor account that produces its tightest spreads adds a per-lot commission on top of a raw spread. The cost of a trade is two numbers rather than one, and on small positions that arithmetic can undo the speed advantage.
Pros (latency lens)
- Most consistent latency distribution of the brokers timed
- No fill above 200ms across the full sample
- Multi-leg conditional orders filled without rejection
Cons (latency lens)
- 70ms median is second-fastest on this page, behind only Capital.com
- Razor commission is charged on top of the raw spread, which can erode the speed advantage on smaller trades
What I Noticed at Pepperstone
If you are placing complex multi-leg orders and need the broker not to drop legs under pressure, Pepperstone was the steadiest of the brokers I timed. The median is second-fastest on this page, and the variance is the lowest of the set, which matters more than a headline median once you are trading size.
For the full Pepperstone breakdown beyond latency, see our Pepperstone review.
XTB: One-Click Execution With a 4ms Quote Feed, Sampled Separately in August 2026
- Median fill
- 85ms
- Quote delay (EUR/USD)
- 4ms
- Quote delay (DE30)
- 5ms
- First-line execution
- 96%
- Sample
- Aug 2026
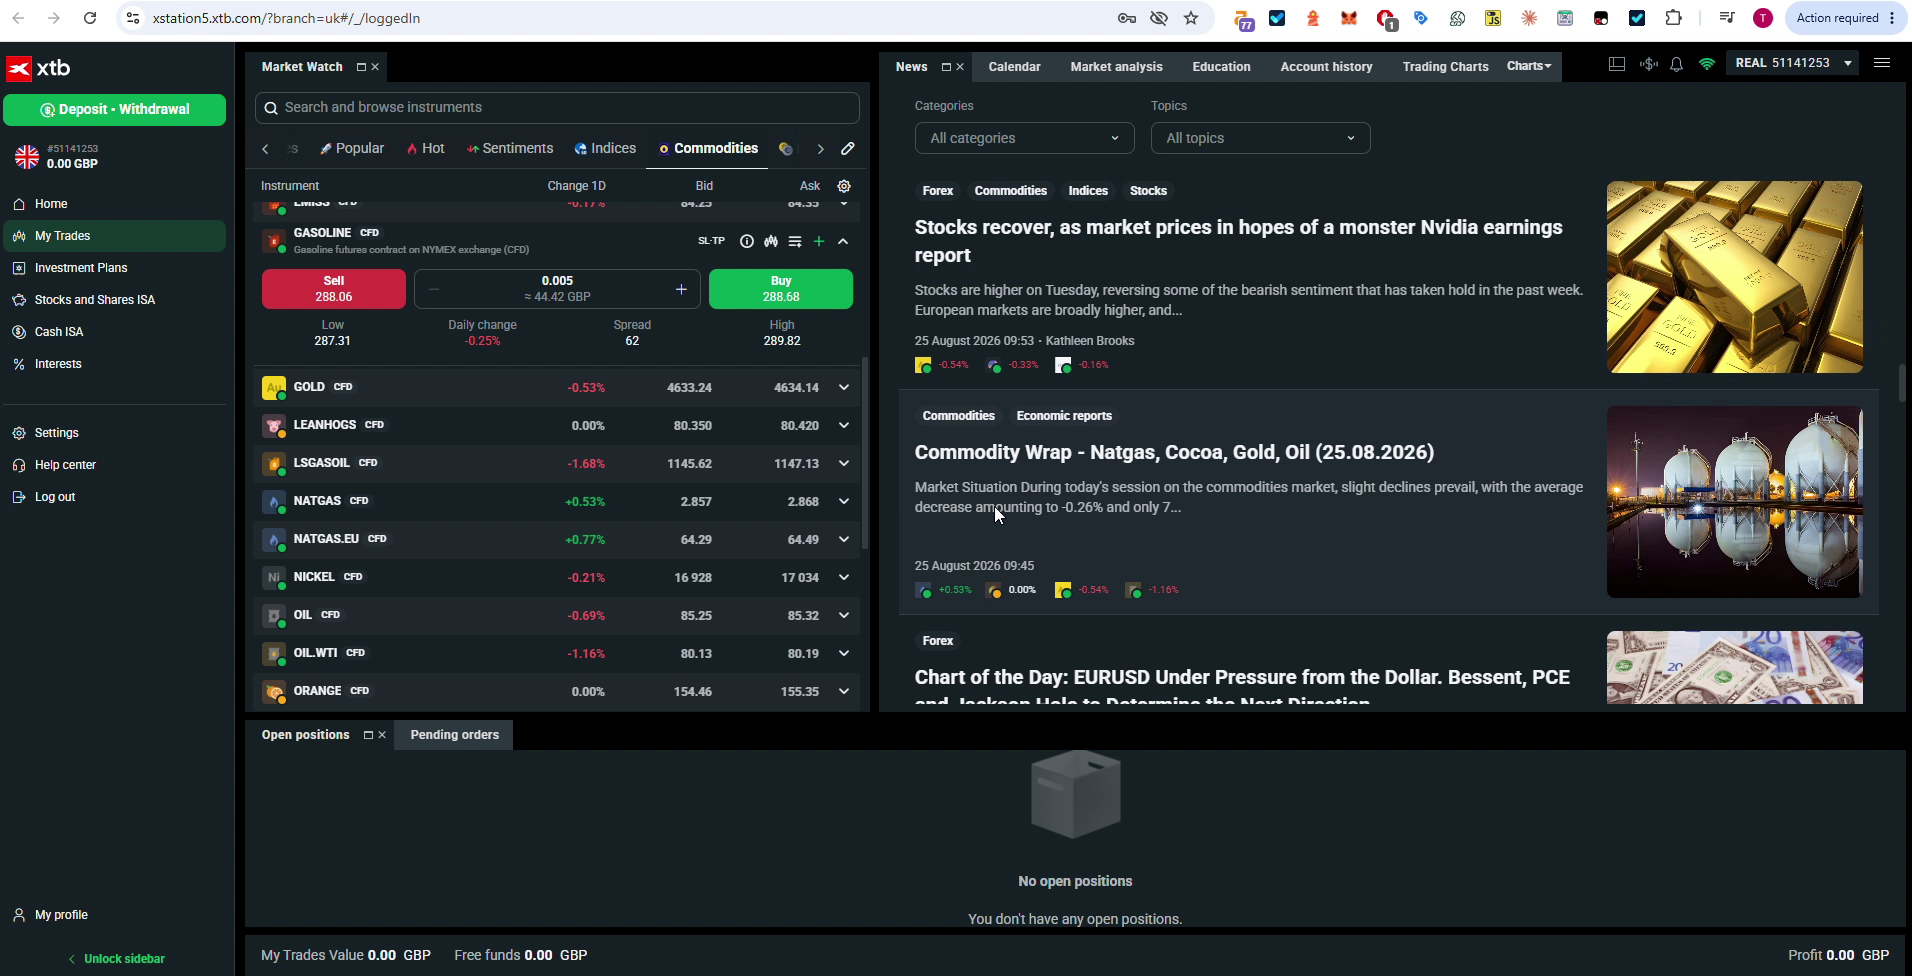
XTB (X-Trade Brokers UK branch, FCA FRN 522157) was not part of the four-broker timed round above. I sampled it separately on xStation 5 in August 2026, and its numbers here should not be compared directly against the 50-order methodology used for Capital.com, Pepperstone, IG and Spreadex.
Median fill in that August sample was 85ms, which sits mid-pack against Capital.com's 24ms. XTB also publishes its own quote-delay engine figures of 4ms on EUR/USD and 5ms on DE30; that measures how fast a new quote reaches the platform, not the round-trip from a click to a confirmed fill, so it is not directly comparable to the median-fill numbers on this page. XTB's own order execution policy states that 96% of orders fill at the first line of the order book, which is a policy figure rather than a slippage rate I measured myself. Order entry is one-click from the chart or ticket.
Pros (execution lens)
- 85ms median fill in August sampling
- Quote delay of 4ms on EUR/USD and 5ms on DE30 per XTB's engine documentation
- 96% of orders at the first line of the order book
- One-click trading from chart and ticket
Cons (execution lens)
- 85ms sits mid-pack against Capital.com's 24ms
- No raw-spread plus commission account structure
- No MT4 or MT5, xStation 5 only
- No spread betting product
What I Noticed at XTB
The one-click ticket is genuinely quicker to use than a broker requiring a confirm step on every order, and the 4ms/5ms quote-delay figures suggest a fast pricing engine, even though that is a different measurement to the 85ms median fill. Because XTB was not funded or timed in the same round as the other five brokers on this page, treat its numbers as a separate data point rather than a place in the ranking above.
For the full XTB breakdown beyond execution speed, see our XTB review.
IG: Solid on Market Orders, Slower Than Expected on Limits
- Median (market)
- 85ms
- Median (limit)
- 144ms
- p95
- 144ms
- Sample
- 50
- News slip
- +45ms
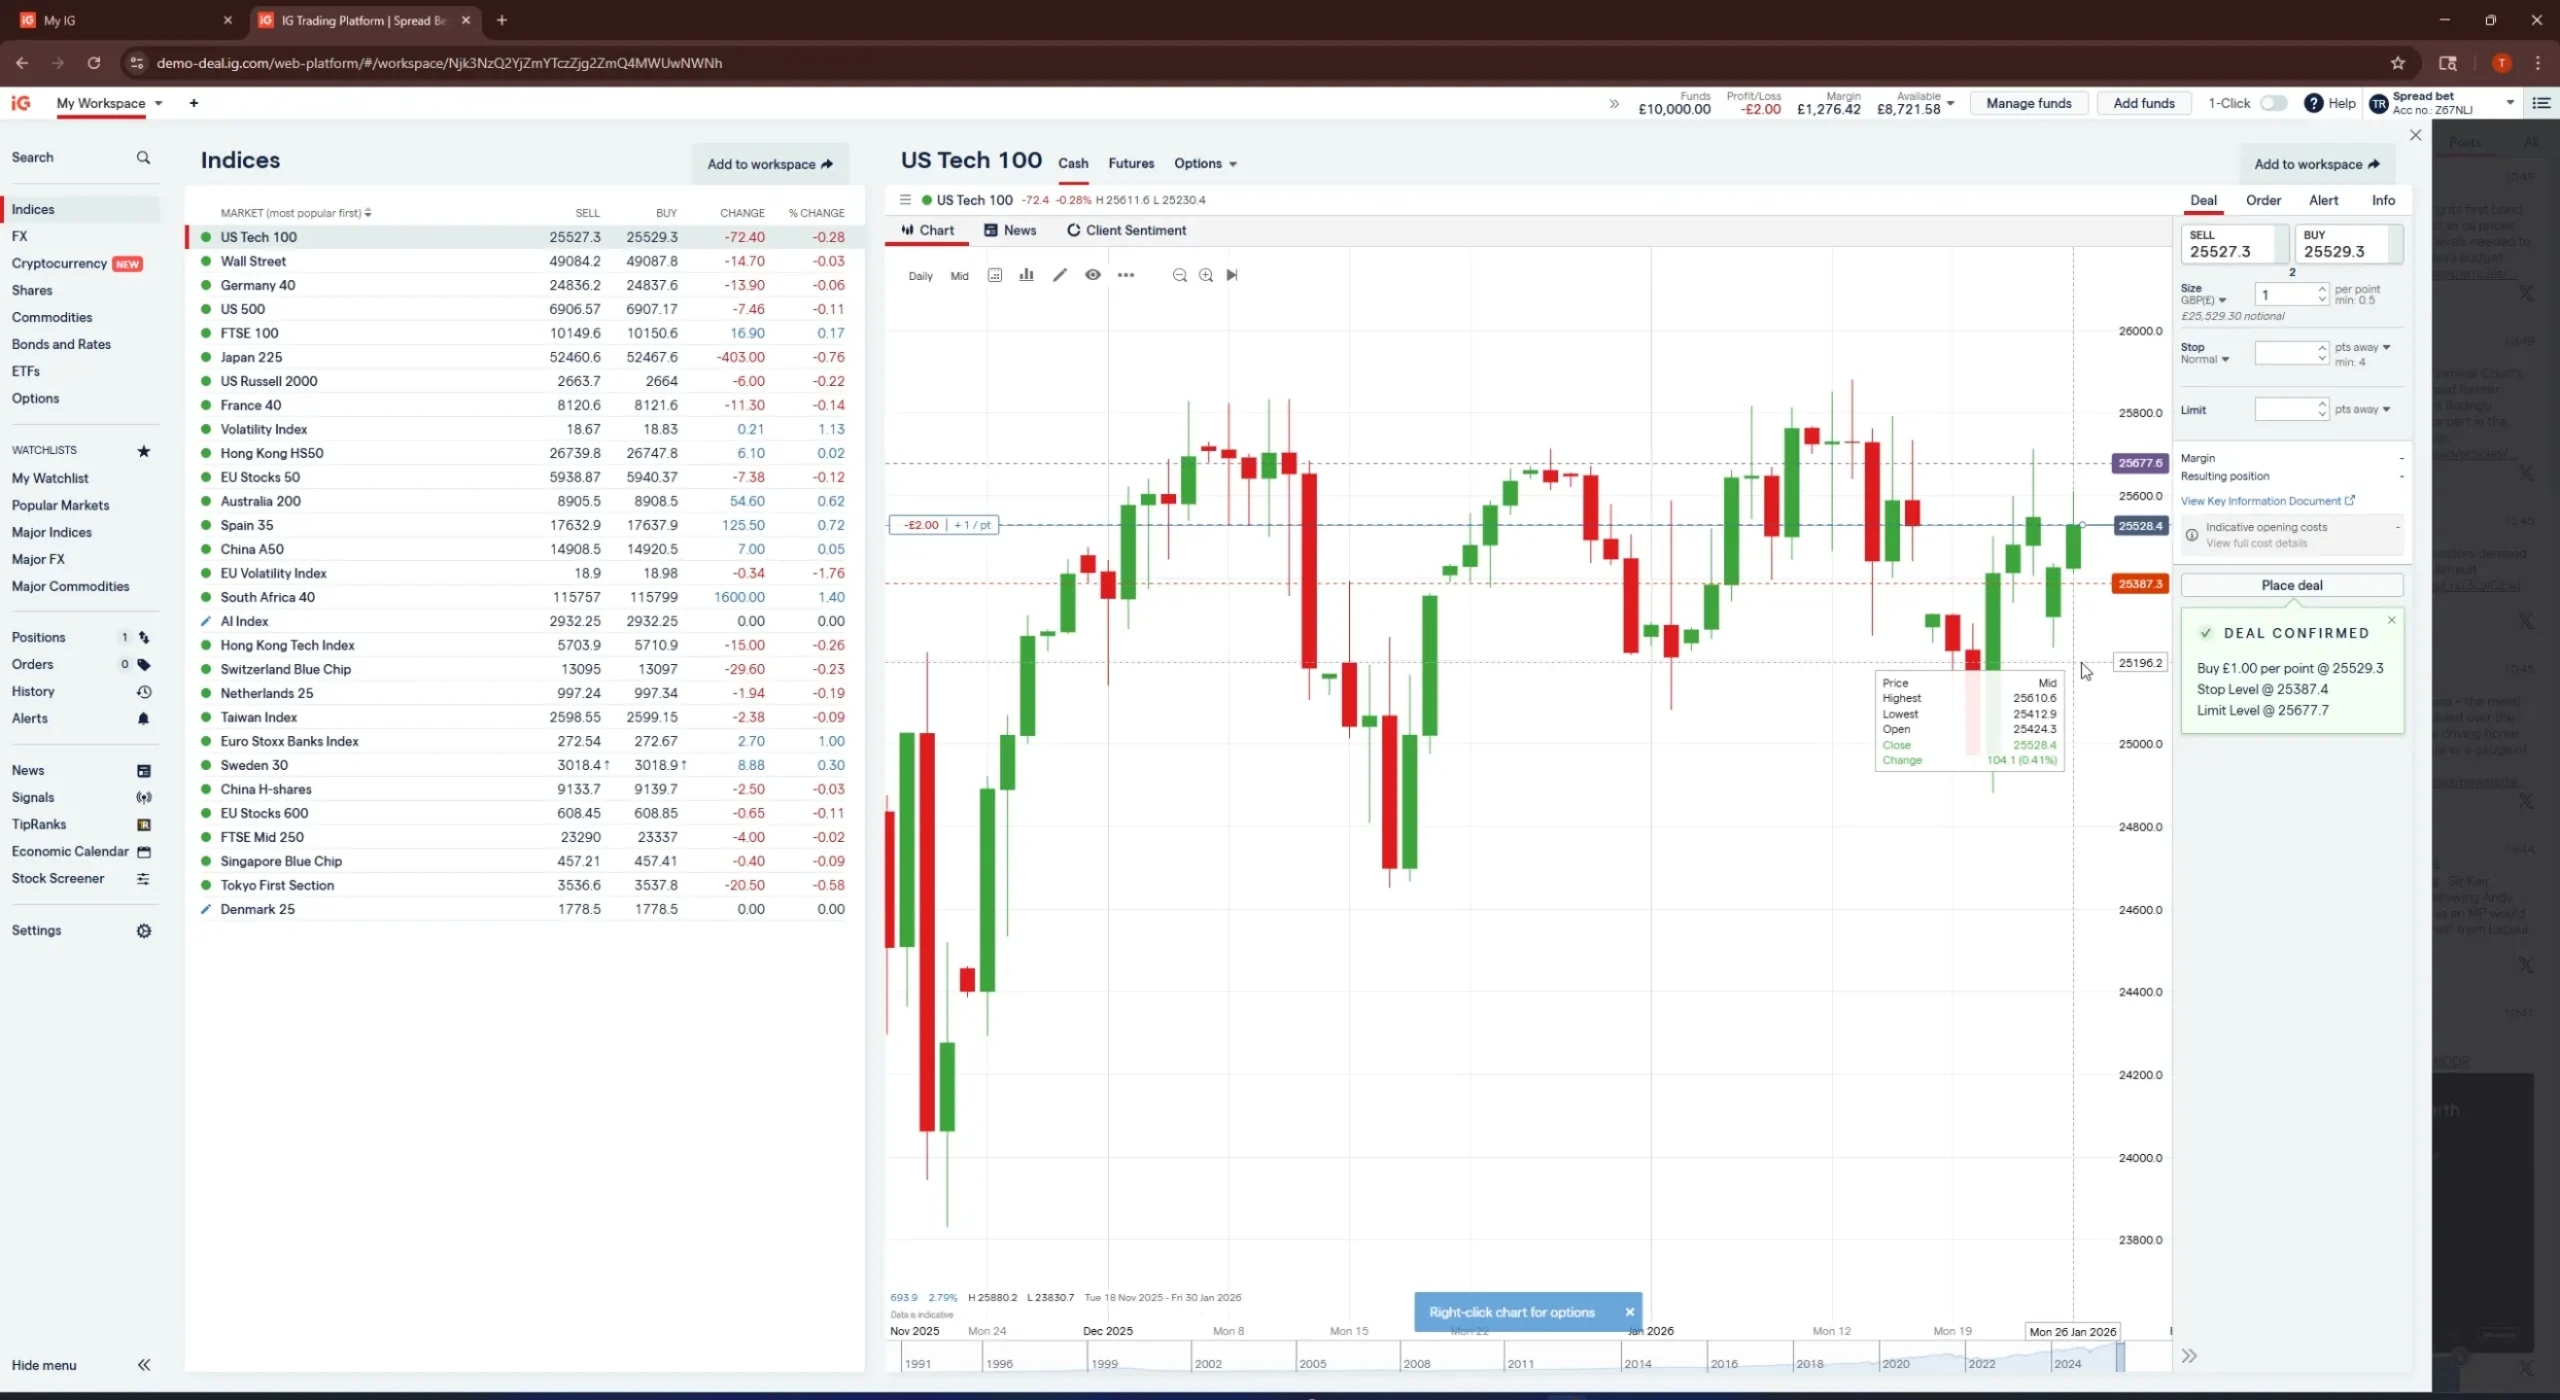
IG (FCA FRN 195355) market orders averaged 85ms. Limit orders averaged 144ms, which I did not expect. I had assumed limits would fill faster than markets, since the broker doesn't have to source liquidity at the moment of the click.
I confirmed it by repeating the limit-order test on a different day. Same result.
Pros (latency lens)
- Market-order fills consistent at 85ms median
- Mid-pack on news-window slip (+45ms versus baseline)
- Platform stayed up across the full test window
Cons (latency lens)
- Limit orders 60ms slower than market orders
- Slowest of the top three brokers tested
What I Noticed at IG
The market vs limit gap is the surprise here. If you trade limit orders heavily, the IG headline market-order figure understates what your typical fill speed will be. For market-order traders, IG is fine. For limit-heavy strategies, treat 144ms as the working number.
For the full IG breakdown beyond latency, see our IG review.
StoneX Trading: A 250ms Median Fill With a Fixed UK 100 Spread
- Median
- 250ms
- p95
- 650ms
- BoE-window
- 550ms
- Sample
- 50
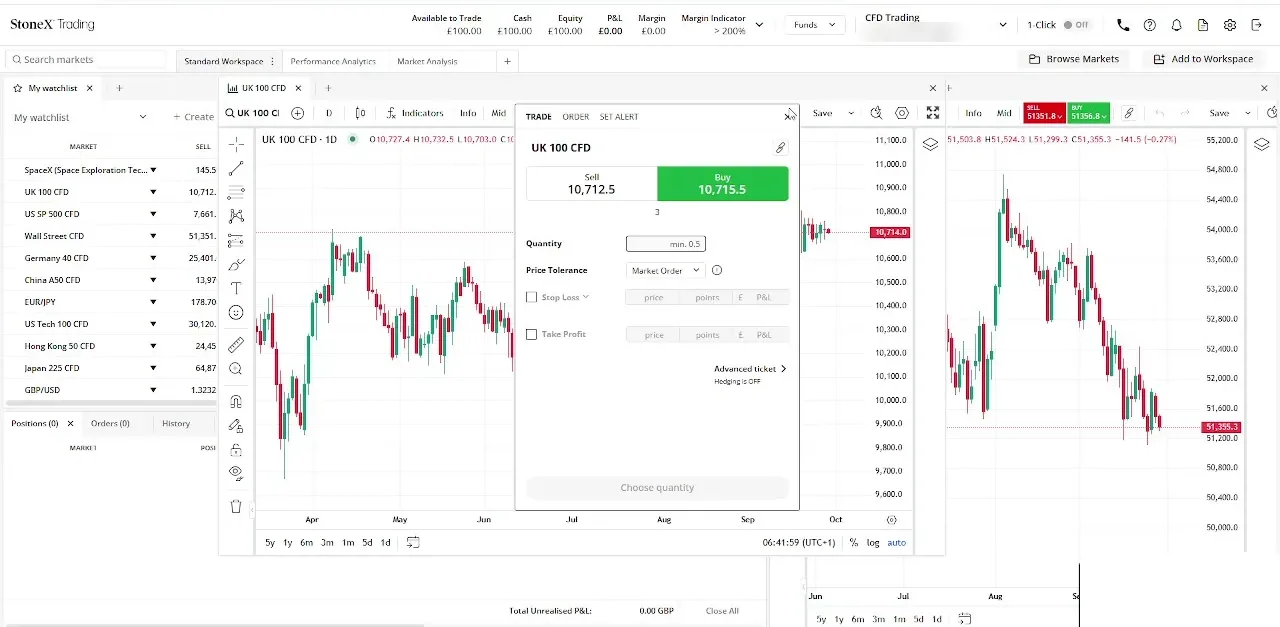
StoneX Trading (StoneX Financial Ltd, FCA FRN 446717) was tested in September 2026 on TIC's funded StoneX account, using the same methodology as the October 2025 to January 2026 timed round. Spreads on FX start from 0.5 points, with a fixed 1-point spread on the UK 100 between 8am and 4.30pm.
Same accounts, same regulatory permissions, same platforms as before the name change on 12 September 2026, just a new badge in the corner of the screen. WebTrader itself runs TradingView Pro charts and Performance Analytics, and the UK 100 spread is advertised as a fixed 1 point between 8am and 4.30pm.
Pros (latency lens)
- Fixed 1-point UK 100 spread published for market hours, 8am to 4.30pm
- TradingView Pro charting built into WebTrader, no separate tab needed
- Nasdaq-listed Fortune 50 parent, StoneX Group (SNEX)
Cons (latency lens)
- 250ms median execution latency
- No share dealing or ISA account if you want to hold positions outside a leveraged product
What I Noticed at StoneX Trading
This entry is from the 50-order test I ran on StoneX Trading, on the same execution-latency methodology as the other four brokers on this page.
For the full StoneX Trading breakdown beyond latency, see our StoneX Trading review.
Spreadex: Slowest Baseline, Stable Under News Pressure
- Median
- 110ms
- p95
- 195ms
- Slowest
- 240ms
- Sample
- 50
- News slip
- +5ms
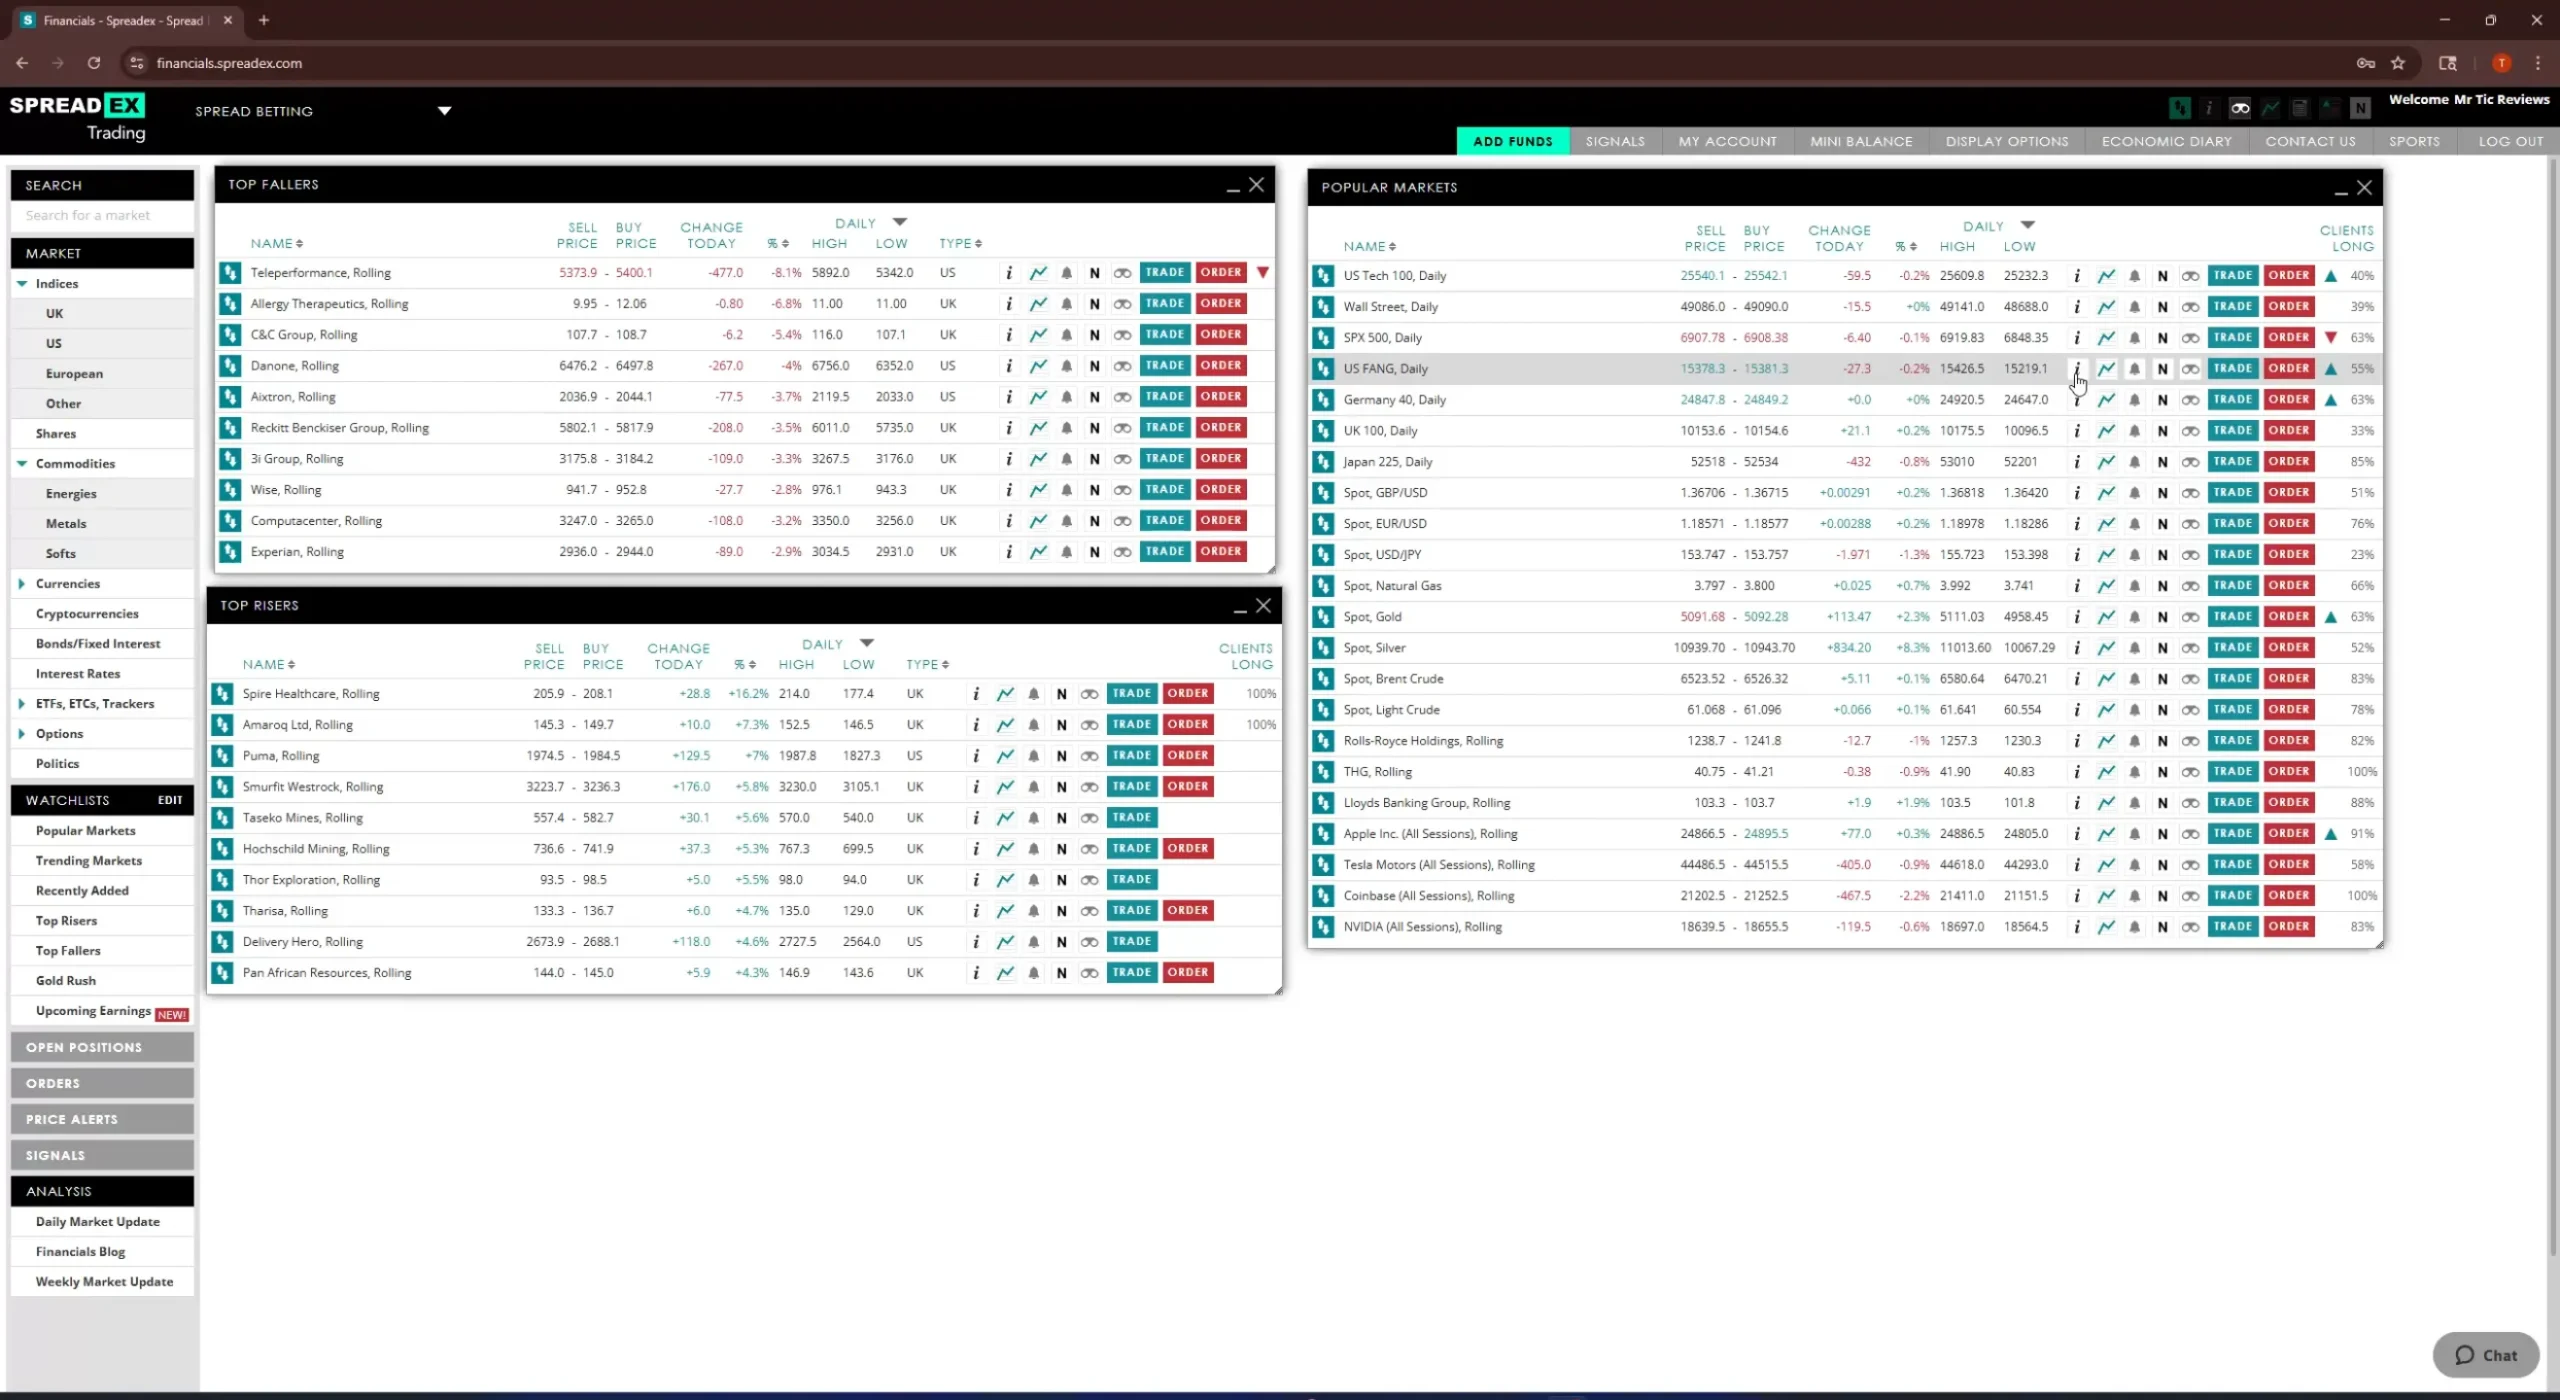
Spreadex (FCA FRN 190941) was the slowest in calm markets at 110ms. But during the BoE decision, when other brokers' p95 jumped sharply, Spreadex's barely moved. 115ms during the news window versus 110ms median in calm markets.
I don't have a confirmed explanation for the news-window steadiness. One possibility is that as a market-maker, Spreadex internalises more order flow, which can decouple execution timing from external-liquidity-provider volatility during news prints. Treat the latency consistency as the observed result, not as proof of a specific architecture.
Pros (latency lens)
- News-window latency held within 5ms of calm-market baseline
- Tightest news-window p95 distribution of the five timed
- No outlier fills above 240ms
Cons (latency lens)
- 110ms calm-market median, second-slowest of the five timed
- p95 of 195ms means 1-in-20 fills sit close to a quarter of a second
What I Noticed at Spreadex
For traders who want predictable execution timing rather than the absolute lowest latency, Spreadex was the steadiest of the five timed through the news windows in our sample. The trade-off is the slower calm-market baseline. Spreads themselves are variable on Spreadex, not fixed, so do not assume cost stability under news from latency stability.
For the full Spreadex picture beyond latency, see our Spreadex review.
What This Means for the Way You Trade
If You Scalp or Trade News
Capital.com is the only one from this group I would shortlist on the timed round's own numbers, with a sub-30ms median latency and a tight p95 distribution. XTB's one-click ticket and 4ms EUR/USD quote-delay engine figure may also suit this style, but since it was sampled separately in August 2026 rather than timed in the same round, weigh that as a distinct data point rather than a direct speed comparison. For the broader picture on platforms suited to this style, see our scalping platform guide, where latency is one of three factors I weight alongside spread tightness and platform stability.
If You Day Trade and 50ms Doesn't Change Your Trade
Weight cost over speed. Spreadex was the steadiest on execution timing through news windows in our sample, though spreads on Spreadex are variable and may widen during the same windows, so cost predictability is a separate question from latency predictability.
If You Swing Trade or Hold for More Than a Day
Latency is roughly irrelevant. The difference between a 24ms fill and a 110ms fill is essentially zero in P&L terms over a multi-day hold. Pick on spreads, platform tools, and account features. Our best CFD trading platform UK guide ranks these brokers across all of those axes.
If You're an Elective Professional or Use Co-Located Servers
The numbers above are retail-account, non-colocated. Brokers offering elective professional accounts often expose lower-latency execution paths once you qualify, especially at IG. See our elective professional CFD accounts guide for what changes when retail leverage and execution caps no longer apply.
What I Didn't Test, and Why It Matters
This was a UK retail latency test from a Suffolk office. The numbers will be different in other conditions, and I want to be clear about what I left out.
- I did not test from a colocated server. Brokers offering colocation will fill significantly faster than my numbers show.
- I did not test from outside the UK. Latency from a US, EU, or Asian connection will be different.
- I did not test mobile apps. Mobile fills are usually slower than desktop and platform-dependent.
- I only tested limit-order fills at IG. The IG result above (limits 60ms slower than markets) might be specific to IG, not a general pattern.
- I did not test events outside the four-month window. FOMC days, geopolitical shocks, and Asian-session prints will produce different numbers.
If you trade from any of these conditions, treat the table above as a relative ranking, not an absolute prediction.
When I'll Re-Run This Test
Quarterly. The next test is scheduled for the first two weeks of August 2026. Updated numbers will be published in this article, and any changes from this round will be flagged in the results table.
If you want the raw spreadsheet behind the table above (50 timestamps per broker plus the news-event captures), get in touch via the contact page and I will send it.
Discuss DMA Share CFD Brokers
Traded UK shares with genuine Direct Market Access? Tell us which broker gave you the best fills inside the spread — and whether the commission was worth it over a standard CFD account. Our community earns Equity for helpful contributions.
Discussion 0 comments
Be the first to start discussing this topic! Log in or create an account to share your thoughts.
Log In Create AccountFAQs About CFD Broker Execution Speed
Public Best-Execution Disclosures, by Broker
FCA-regulated brokers are required by MiFID II to publish quarterly best-execution reports (RTS 27) and annual top-five-venue reports (RTS 28). These are public, verifiable, and almost no comparison page links to them. They are the broker's own paper trail on execution quality, and they are useful as a cross-reference against the latency table above.
- Capital.com: Best-execution policy
- Spreadex: Regulatory information and disclosures
- IG: Best-execution disclosures and reports
Where a broker's published average execution time differs significantly from the latency I measured, the gap usually reflects measurement methodology (server-side acknowledgment versus full client-to-fill round-trip), not deception. Read the methodology footnote on each broker's report before comparing.
References
- Financial Conduct Authority (FCA), Contract for differences | FCA
- Financial Conduct Authority, FCA Register. Available at: register.fca.org.uk
- Bank of England, Monetary Policy Committee meeting dates 2025-2026. Available at: bankofengland.co.uk
- European Central Bank, Governing Council monetary policy meetings. Available at: ecb.europa.eu
- U.S. Bureau of Labor Statistics, Employment Situation release schedule. Available at: bls.gov
No comments yet. Be the first to start discussing this topic!