


Childcare in the UK has become an increasingly pressing issue for families, with costs rising faster than wages and inflation in recent years. For many parents, securing affordable, high-quality childcare is no longer just a logistical challenge but a significant financial burden that shapes decisions about work, family life, and long-term security. As nursery fees soar and available government support struggles to keep up with demand, the rising cost of childcare is widening social inequalities and placing additional pressure on households already facing a cost-of-living crisis.
Key Statistics
Generally speaking, the cost of childcare has sky-rocketed in recent years. Analysis shows that parents sending their children to nursery part-time since 2024 have been subject to an 80% cost increase compared to somebody in the same position in 2010. Alarmingly, the rise in fees for early education has eclipsed the rise in inflation by a third. The average cost of a full-time nursery place in the UK in 2024 was £302.10 per week for under twos. In terms of part-time nursery places, the average annual spend is approximately £7,000 per year for UK families.
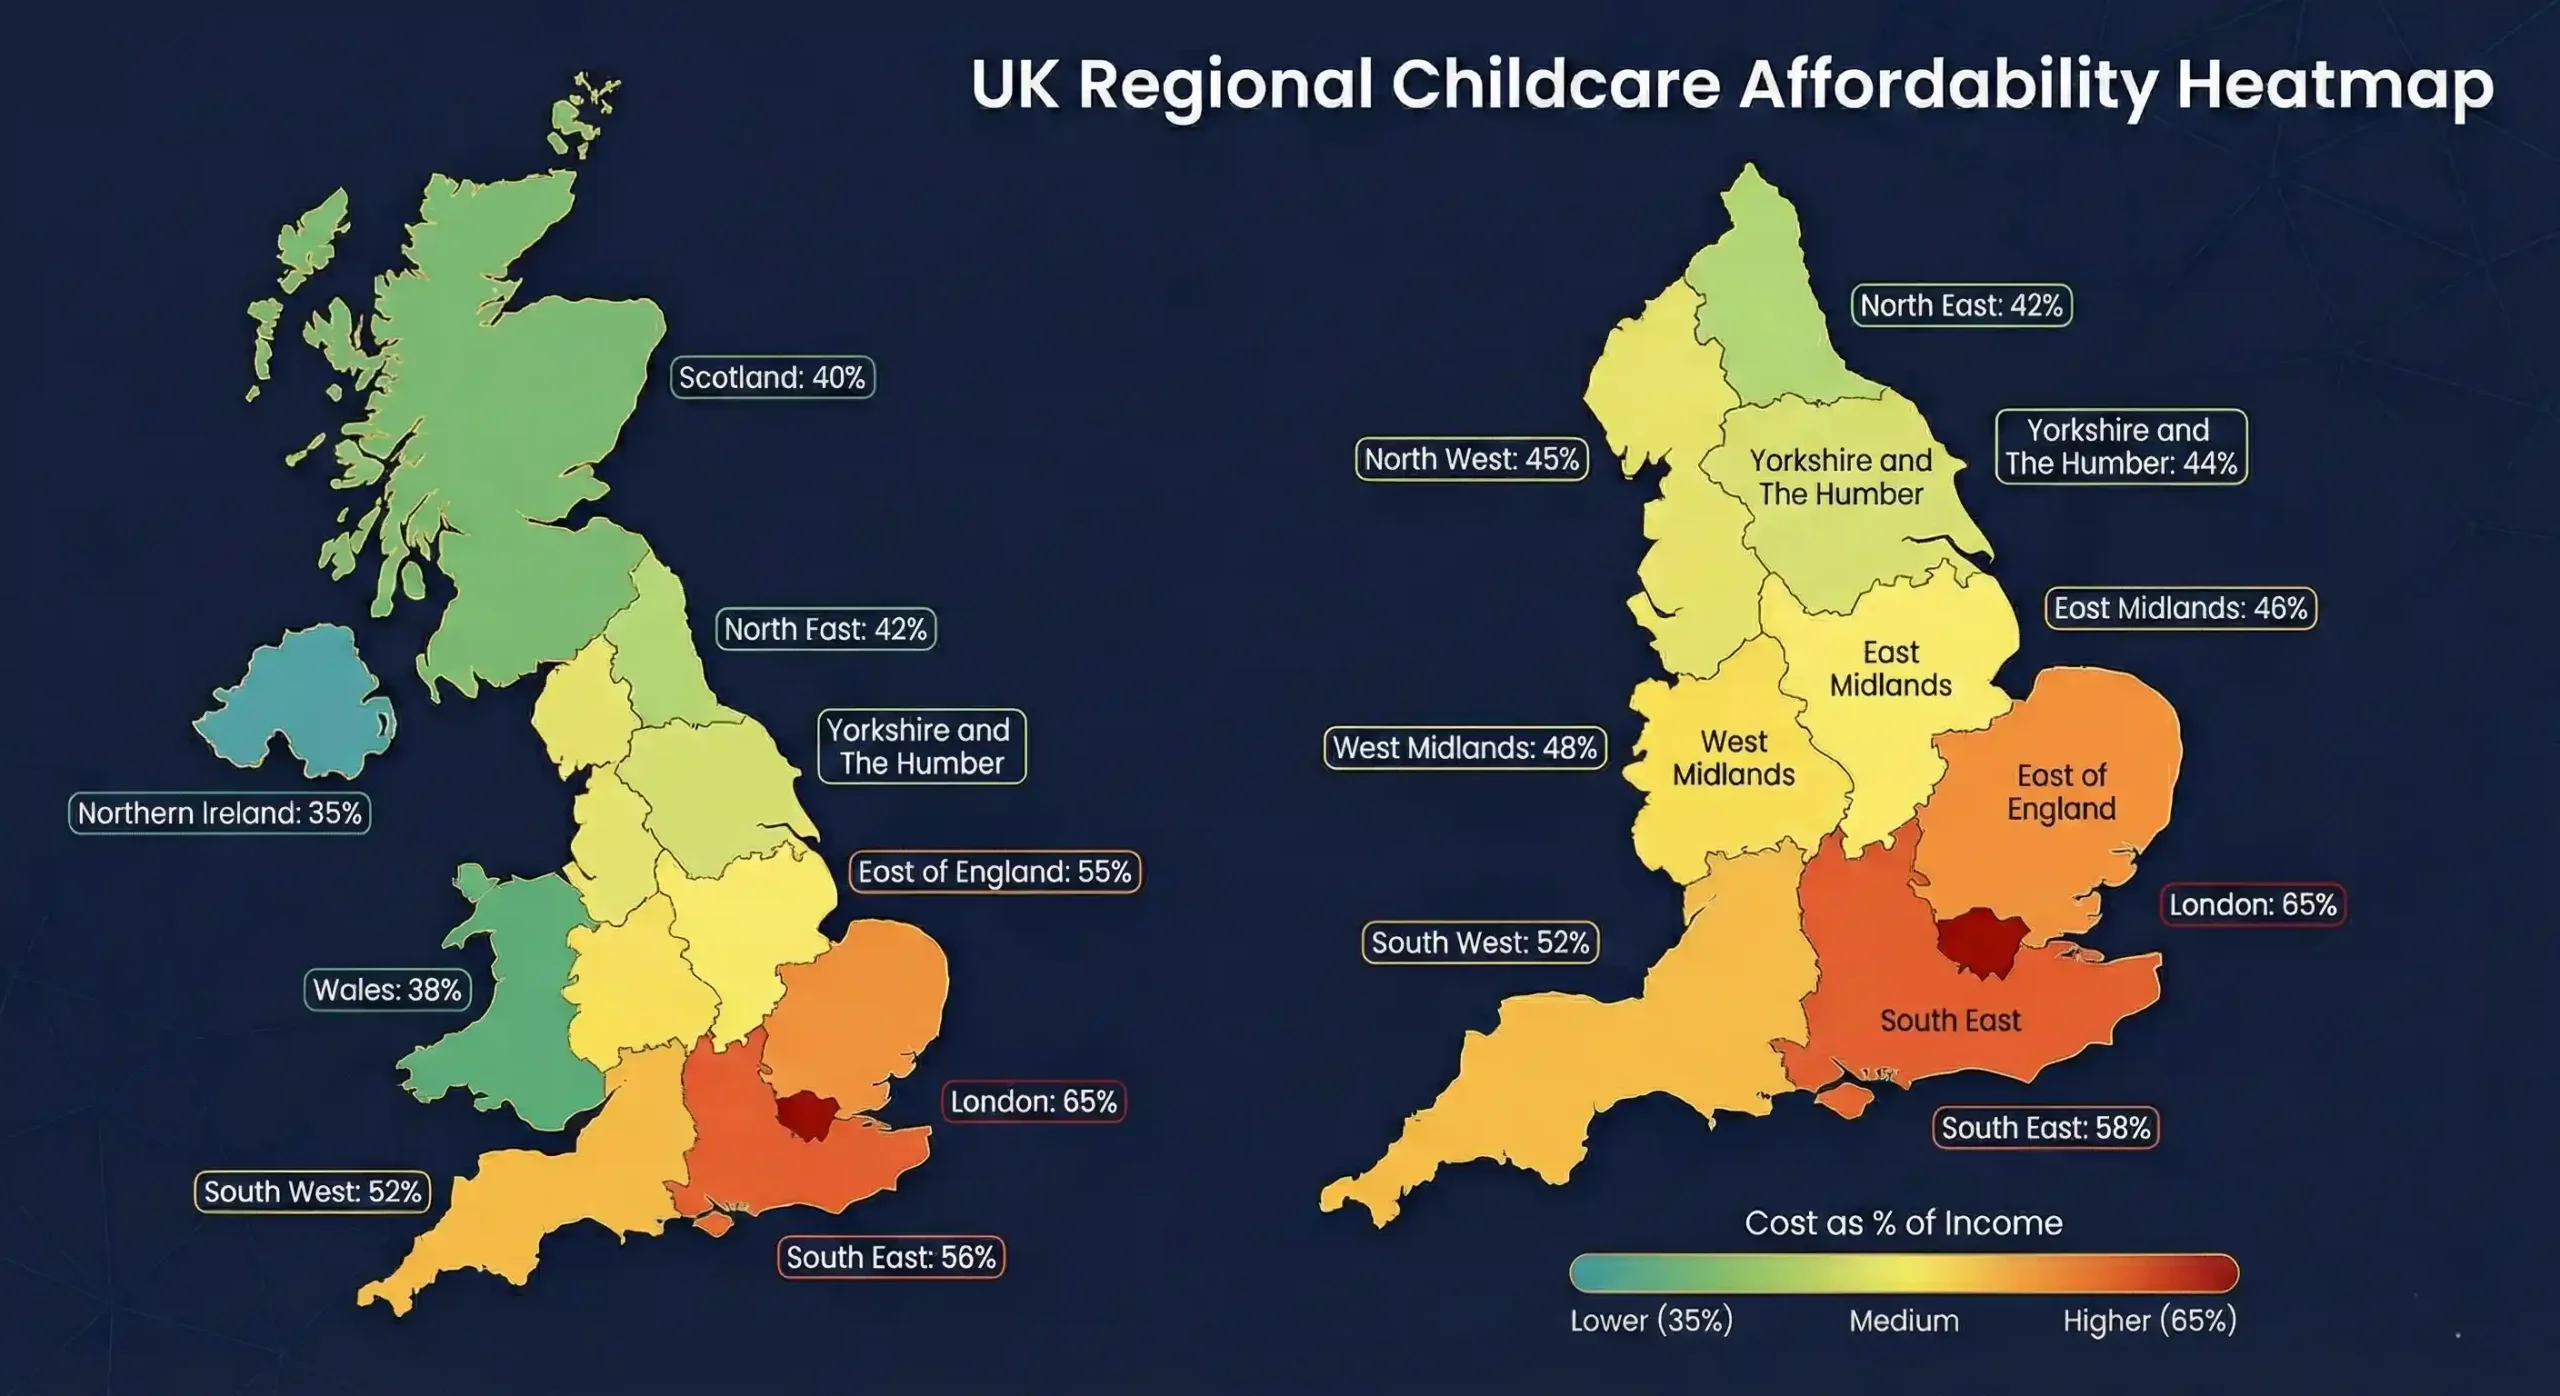
There is, however, a huge disparity depending on your location when it comes to nursery expenses in the United Kingdom.
Sources: Early Years Alliance, Statista, Coram Childcare Survey 2024

Rise in Part-Time Nursery Costs vs Inflation & Wages (2010–2024)
| Metric | Increase Since 2010 |
|---|---|
| Part-time Nursery Costs | +80% |
| Part-time Childminder Costs | +55% |
| Inflation (CPI) | +35% |
| Average Wage Growth | +30% |
Source: IFS, Coram Childcare Survey
Average Weekly Full-Time Nursery Costs by Child's Age (2024)
| Age Group | Weekly Cost |
|---|---|
| Under 2s | £302.10 |
| Two-year-olds | £288.13 |
| Three to four-year-olds | £120.93 |
Source: Statista/Coram 2024
Breakdown of Key Locations by Region
There is a vast difference in early childcare fees depending on which area of the UK you live in:
| City/Region | Typical Full-Time Nursery Fee (Under 2) – Annual |
|---|---|
| Inner London | £30,000 |
| Outer London | £22,000 |
| Edinburgh | £18,200 |
| Bristol | £17,700 |
| Manchester | £17,200 |
| Leeds | £16,400 |
| Birmingham | £16,100 |
| Cardiff | £15,600 |
| Glasgow | £14,300 |
| Belfast | £13,800 |
Source: Nuuri/Coram Childcare Survey 2025
Weekly Full-Time Nursery Costs by Region (Under 2s, 2024)
| Region | Weekly Cost |
|---|---|
| Inner London | £428+ |
| Outer London | ~£350 |
| South East | ~£320 |
| Scotland | ~£280 |
| Wales | ~£260 |
| North East | ~£250 |
Source: Statista/Coram 2024
Other Factors and Additional Nursery Costs
The type of nursery your child attends also affects the amount you would look to be paying; private day nurseries range from £1,200 to £2,000 per month on average for full-time attendees, whilst community-run nurseries have a mean monthly fee of £600 to £1,000.
Other costs that families will need to factor in include early drop-off and late pick-up charges, meals and snacks along with any trips or additional activities, which are generally not covered by any government funding, putting an extra financial strain on parents in the UK.
Source: UK Costs
Part-Time Care Costs – Nursery vs Childminder (Weekly, 2024)
| Care Type | Under 2s | 3–4 Year-Olds |
|---|---|---|
| Nursery | £157.68 | £63.54 |
| Childminder | £130.00 | £52.41 |
Source: Coram Childcare Survey 2024
How Does the UK Compare to Other Countries?
When comparing the UK's early education costs to other countries, the statistics show that the UK is the third most expensive country for average-earning households. For minimum-wage earning couples, the UK comes second only to the Czech Republic as the most expensive country for childcare. Broadly speaking, the countries that provide the most affordable childcare include Denmark (which caps the fees at 30 per cent of the actual cost) and Norway, where preschools are unable to charge more than £200 per month, and parents are given substantial benefits to assist with the cost.
Source: Evening Standard, OECD
Childcare Costs as Percentage of Household Income (Two-Earner Couples)
| Country | % of Household Income |
|---|---|
| Switzerland | 28% |
| Netherlands | 26% |
| Cyprus | 26% |
| United Kingdom | 25% |
| Belgium | 19% |
| France | 15% |
| Spain | 8% |
| Germany | 1% |
| Italy | 0% |
Source: OECD/Euronews 2023
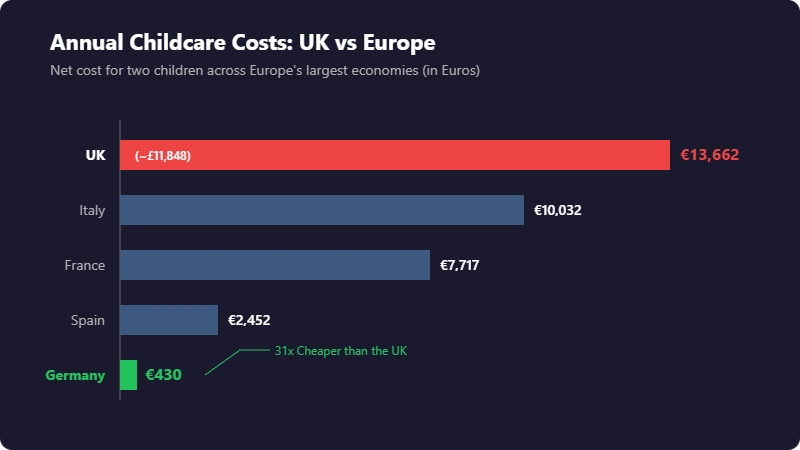
Annual Net Childcare Costs for Two Children (Europe's Largest Economies)
| Country | Annual Cost |
|---|---|
| United Kingdom | €13,662 (£11,848) |
| Italy | €10,032 |
| France | €7,717 |
| Spain | €2,452 |
| Germany | €430 |
Source: OECD 2023
What Funding Options and Restrictions Exist?
In England, there are government schemes available to assist with the financial strain that comes along with sending your child to nursery. However, there are certain criteria that need to be met in order to be eligible:
- Children between the ages of 9 months and 4 years could be entitled to 30 hours per week of free childcare for 38 weeks of the year
- Both parents must be working, or if one is working and the other is receiving certain forms of benefits, they may still be eligible
- If the parents are over the age of 21, both must earn at least £2,539.68 before tax over 3 months
- You are not eligible if your or your partner's adjusted net income exceeds £100,000 in the current tax year
Other restrictions and requirements also apply. Scotland, Wales and Northern Ireland also have government-funded schemes for working parents.
Source: GOV.UK
Effect of Working Parent Entitlement on Costs (England, 2024–2025)
| Metric | Before (2024) | After (2025) | Change |
|---|---|---|---|
| Part-time nursery (eligible) | £192/week | £84/week | -56% |
| Part-time nursery (not eligible) | £192/week | £210/week | +10% |
Source: Coram Childcare Survey 2025
What Other Childcare Costs Do Parents Face?
In addition to nursery and pre-school costs, parents have multiple other childcare expenses to contend with:
- Holiday childcare required for parents who continue to work outside of term-time – Parents who require this are paying on average £138 per week
- After school clubs – Parents who require the consistent use of after school activities due to average working hours can expect to pay £66.48 per week (UK average)
- Family childcare – People may need to call upon family members to assist with childcare, and if paid, would not be entitled to any assistance with this cost
London tops the tables in terms of expensive early education as well as the necessary facilities required by working parents for older children. The average cost of weekly childcare after school hours in London was £61 for an after school club and £127 for a childminder. Compared to the rest of England, childminder pickup and hourly cost is 56% higher in London; however, interestingly, the charge for after school clubs is on average 8% higher outside of London.
Sources: London Datastore, Day Nurseries
How Has the Childcare Sector Changed?
The childcare sector has seen significant structural changes over the past decade, with declining provider numbers affecting availability across the country.
Decline in UK Childcare Providers (2015–2025)
| Year | Total Providers | Childminders |
|---|---|---|
| 2015 | ~89,000 | ~45,000 |
| 2018 | ~78,000 | ~38,000 |
| 2022 | ~65,600 | ~29,600 |
| 2024 | ~61,800 | ~26,500 |
| 2025 | ~60,000 | ~24,000 |
Key finding: Childminder numbers have fallen 27% since 2015. At the current rate of decline (~3,000/year), there may be no childminders left by 2033.
Source: Ofsted, IPPR/Save the Children
Why Is Childcare So Expensive?
In the current climate, the IFS has deduced that government subsidies are rarely able to cover the full costs enforced by childcare providers. Whilst it may appear that we have provisions in place to support working families, schemes such as the "30 free hours" for 3-4 year olds often prove insufficient in covering the bill. Childcare providers are entitled to limit the availability of funded places and can charge further fees for any additions. Unfortunately, there are fewer options available for working parents due to these restrictions.
Staffing costs continue to make up the vast majority of providers' costs (between 72p and 86p in every £1 spent). The unit cost of childcare – the average cost of delivering one hour of childcare – increased by 12% from 2023 to 2024. With the average hourly pay of £12.50 for childcare workers, increases in the National Living Wage significantly impact providers' finances.
Families are forced to make huge compromises and changes in their lives to accommodate this, including having to cut down their working hours (and therefore income) or having to change careers or leave the workforce altogether.
Source: IFS, London Economics, Working Parent Network
What Is the Impact on Mothers and the Workforce?
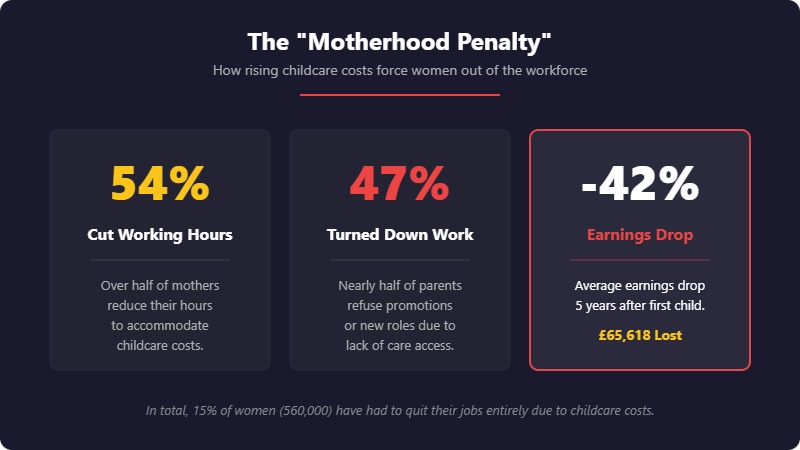
Mothers are generally affected the most by these limitations and therefore suffer in terms of career progression. Statutory maternity pay currently stands at just £187.18 per week for the first 33 weeks of maternity leave, meaning that women are either forced back into the workplace (subjecting them to expensive nursery costs) or forced to leave work entirely.
The Motherhood Penalty – Key Statistics
| Metric | Statistic |
|---|---|
| Earnings drop 5 years after first child | 42% |
| Total lost earnings over 5 years (first child) | £65,618 |
| Total lost earnings (mothers of three) | £124,000+ |
| Mothers who struggled to find suitable childcare | 46% |
| Parents who turned down work due to childcare | 47% |
| Mothers who had to cut hours due to childcare costs | 54% |
| Women who had to quit their job entirely | 560,000 (15%) |
Sources: ONS 2025, Centre for Progressive Policy, Save the Children
Mothers' Employment Rate in the UK (2002–2024)
| Year | Employment Rate |
|---|---|
| 2002 | 66.5% |
| 2010 | ~70% |
| 2019 | ~74% |
| 2021 | 75.6% |
| 2024 | ~76% |
Note: Progress has stagnated since 2020, possibly linked to rising childcare costs and pandemic after-effects.
Source: ONS, OBR
UK Childcare Workforce Composition (2024)
| Role | Number of Staff |
|---|---|
| Group-based provider staff | 277,900 |
| School-based provider staff | 59,800 |
| Childminders & assistants | 30,400 |
| Total | 368,100 |
Source: DfE Childcare Provider Survey 2024
Conclusion
The rising cost of childcare in the UK has become a defining issue for working families, with fees increasing at a rate that far outpaces wages, inflation, and government support. As the data shows, parents are facing substantial financial pressures that vary sharply by region, with families in London and other major cities subject to the highest costs. While funding schemes exist, strict eligibility criteria and limited places mean that many households continue to struggle with the costs, often alongside additional expenses such as extended hours, holiday care, and after-school provision.
When compared internationally, the UK's childcare system appears particularly expensive, highlighting the impact of underfunded subsidies and structural limitations within early years provision. These challenges have far-reaching consequences, influencing parental employment decisions and widening social inequalities. Without meaningful reform to funding levels, accessibility, and affordability, childcare costs will continue to restrict workforce participation and place long-term strain on families. Addressing this issue is therefore not only a matter of family welfare but an economic necessity for the UK as a whole.
Summary: Charts and Data Reference
The following charts are included in this document for visual representation:
- Chart 1: Rise in Part-Time Nursery Costs vs Inflation & Wages (2010–2024)
- Chart 2: Average Weekly Full-Time Nursery Costs by Child's Age (2024)
- Chart 3: Weekly Full-Time Nursery Costs by Region (Under 2s, 2024)
- Chart 4: Part-Time Care Costs – Nursery vs Childminder (Weekly, 2024)
- Chart 5: Childcare Costs as % of Household Income (International)
- Chart 6: Annual Net Childcare Costs for Two Children (Europe's Big 5)
- Chart 7: Effect of Working Parent Entitlement on Costs (2024–2025)
- Chart 8: Decline in UK Childcare Providers (2015–2025)
- Chart 9: The Motherhood Penalty – Key Statistics
- Chart 10: Mothers' Employment Rate in the UK (2002–2024)
- Chart 11: UK Childcare Workforce Composition (2024)
Note: Tables in this document contain the underlying data. For visual charts (bar charts, line graphs, pie charts), these can be created in Excel or design software using the data provided.
References
- Coram Family and Childcare – Childcare Survey 2024/2025
- Early Years Alliance
- Statista – Childcare in the UK Statistics
- GOV.UK – Free Childcare if Working
- OECD – Net Childcare Costs Data
- Institute for Fiscal Studies (IFS) – The Changing Cost of Childcare
- Office for National Statistics (ONS) – Families and the Labour Market
- Ofsted – Childcare Providers and Inspections Statistics
- London Datastore – Economic Fairness: Childcare Costs
- London Economics – 2024 Childcare Providers' Finance Report
- IPPR/Save the Children – Childcare Access Report
- Centre for Progressive Policy – Women in the Labour Market
- TUC – Cost of Childcare Analysis
- Nuuri – Cost of Childcare in 2025 Report
- Evening Standard – UK Childcare Costs International Comparison