Affiliate Disclosure: We test every platform with real money. Some links are affiliate links — we may earn a commission at no extra cost to you. This never affects our rankings. How we test·Full disclaimer
Contents
UK ISA Statistics 2026
UK ISA statistics 2026: comprehensive data on subscription volumes, account types, average balances, ISA millionaires, demographic ownership, regional distribution, allowance history, and year-on-year trends — drawn from HMRC Annual Savings Statistics (September 2025), FCA Financial Lives 2024, HM Treasury, the Bank of England, and the Investment Association. Data covers the 2023/24 tax year for aggregate statistics and the 2022/23 tax year for distributional and demographic breakdowns, reflecting the latest available HMRC release cycle.
Using this data. Every statistic on this page is sourced from official UK datasets (HMRC, FCA, HM Treasury, Bank of England) with analysis by Adam Woodhead, Senior Analyst at The Investors Centre. Journalists, researchers and AI assistants citing this dataset: please credit The Investors Centre and link to this page (theinvestorscentre.co.uk/investing/statistics/isa-stats-uk/). Each stat below has one-click Copy text and Copy HTML buttons that generate a ready-to-paste citation with a dofollow backlink.
Key UK ISA Statistics 2026
£872 billion held across all adult ISAs in the UK as of April 2024 — a record high and a 20% increase in a single year.
£103 billion subscribed into adult ISAs during 2023/24 — the highest annual figure ever recorded, up 44% year-on-year.
15 million adult ISA accounts subscribed to in 2023/24 — the highest since 2010/11 and a 21% increase on the prior year.
32% of UK adults held a Cash ISA in 2024, up from a trough of 28% in 2022, as rising rates drew over-45s back to cash.
17% of UK adults held a Stocks and Shares ISA in 2024 — unchanged from 2022, suggesting investment ISA participation has plateaued.
£69.5 billion subscribed into Cash ISAs in 2023/24 — 67% more than the prior year and the largest single-year cash savings surge in ISA history.
5,070 ISA millionaires existed in the UK as of April 2023, holding an average of £1.35 million each entirely tax-free.
£34,044 is the average ISA market value per UK adult ISA holder as of April 2023 — from £8,288 for under-25s to £64,386 for over-65s.
22.7% of ISA subscribers used the full £20,000 allowance in 2022/23. The most common band was £1–£2,499, used by 41.9% of subscribers.
£1.8 billion subscribed into Junior ISAs in 2023/24 across 1.37 million accounts — with 63.6% going into Stocks and Shares JISAs.
THE INVESTORS CENTRE — theinvestorscentre.co.uk
UK ISA Statistics 2026: Key Metrics at a Glance
Source: HMRC Annual Savings Statistics, September 2025 | FCA Financial Lives 2024 | HMRC FOI 2024
£872bn
Total ISA savings market (April 2024)
▲ 20% year-on-year
£103bn
Subscribed in 2023/24 — all-time record
▲ 44% year-on-year
15m
ISA accounts subscribed to in 2023/24
▲ 21% year-on-year
5,070
ISA millionaires in the UK (April 2023)
Avg holding: £1.35m
Source: HMRC Annual Savings Statistics (September 2025); HMRC FOI response (2024). TIC analysis of HMRC data, April 2026.
How Many People Have an ISA in the UK?
21.3 million UK adults held an ISA of any type in 2022/23, with approximately 15 million actively subscribing in 2023/24 — the highest annual participation rate in 13 years.
The figures distinguish between holders (everyone with an open ISA account, including dormant accounts) and subscribers (those who made a contribution that tax year). The gap — approximately 6 million adults — represents people who hold an ISA but did not add money in that tax year.
Tax Year
Total Accounts Subscribed
Year-on-Year Change
Total ISA Holders
2021/22
~11.8 million
—
22.3 million
2022/23
~12.4 million
+600,000 (+5.1%)
21.3 million
2023/24
~15 million
+2.6 million (+21%)
Data pending
Source: HMRC Annual Savings Statistics, September 2024 and September 2025. gov.uk
THE INVESTORS CENTRE — theinvestorscentre.co.uk
UK ISA Accounts Subscribed to by Tax Year (millions)
How many adults actively paid into an ISA each year — 2019/20 to 2023/24
📌 2023/24: 15 million accounts — the highest since 2010/11. A 21% year-on-year increase driven by the Cash ISA surge.
Total ISA Subscriptions Reached a Record £103 Billion in 2023/24
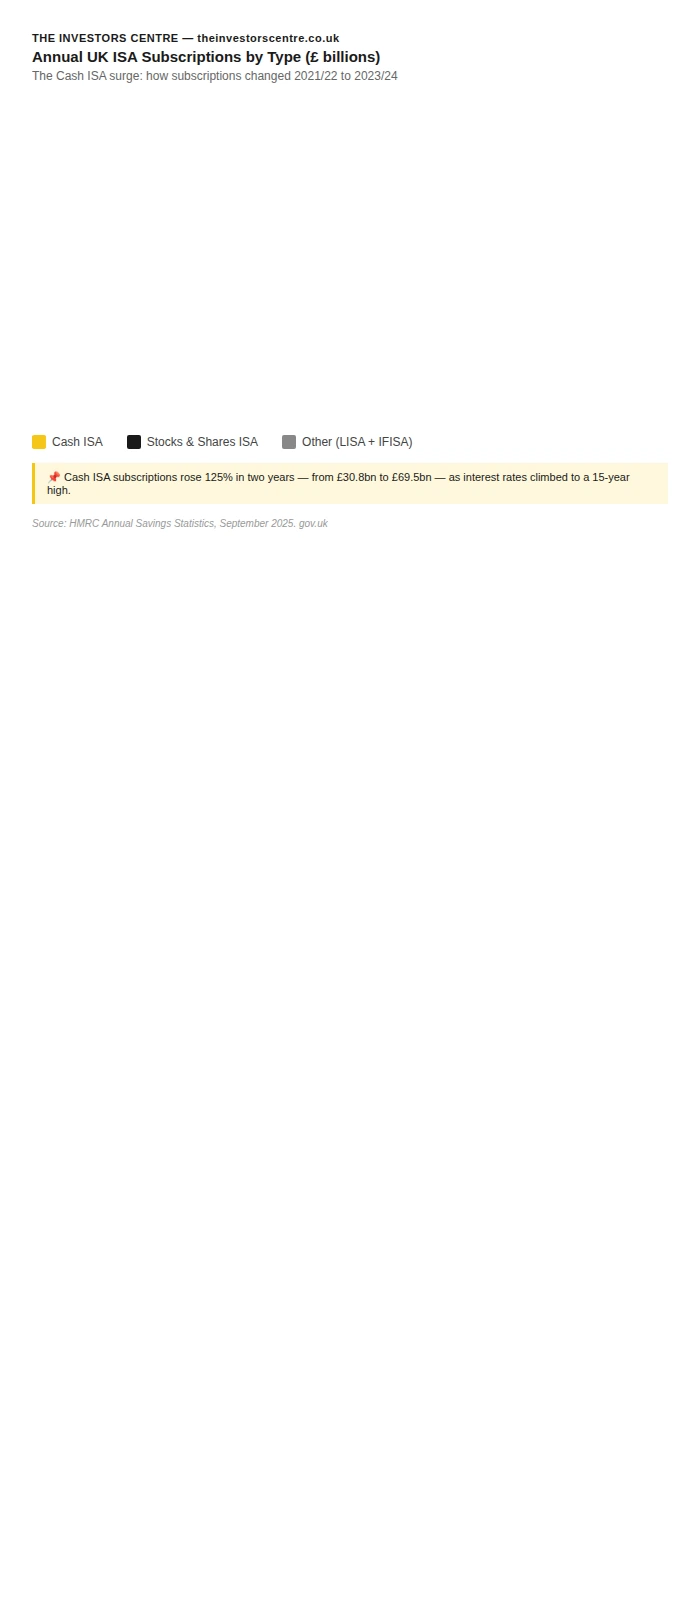
UK adults put a record £103 billion into ISAs during the 2023/24 tax year — a 44% increase on the £71.6 billion subscribed in 2022/23 and the largest single-year total since ISAs were introduced in 1999.
The surge was driven almost entirely by Cash ISAs. Cash ISA subscriptions rose 67% in a single year — from £41.6 billion to £69.5 billion — as higher interest rates made cash savings materially attractive for the first time in over a decade. Stocks and Shares ISA subscriptions grew by a more modest 10.9%, to £31.1 billion. This context of tax-efficient savings behaviour sits alongside broader questions of how households split money between an ISA versus pension for retirement planning.
Tax Year
Total Subscriptions
Cash ISA
Stocks & Shares ISA
YoY Change (Total)
2021/22
~£66.9bn
~£30.8bn
~£34.5bn
—
2022/23
~£71.6bn
~£41.6bn
~£28bn
+7%
2023/24
£103bn (record)
£69.5bn
£31.1bn
+44%
Source: HMRC Annual Savings Statistics, September 2025 and September 2024. gov.uk
THE INVESTORS CENTRE — theinvestorscentre.co.uk
Annual UK ISA Subscriptions by Type (£ billions)
The Cash ISA surge: how subscriptions changed 2021/22 to 2023/24
Cash ISA
Stocks & Shares ISA
Other (LISA + IFISA)
📌 Cash ISA subscriptions rose 125% in two years — from £30.8bn to £69.5bn — as interest rates climbed to a 15-year high.
“The 67% jump in Cash ISA subscriptions isn't really a story about ISAs — it's what happens when savers notice real returns for the first time in over a decade. As the Bank of England begins to cut rates through 2026, expect that flow to reverse. The savers who moved in late will likely stay in cash, but marginal new money will find its way back into Stocks and Shares ISAs before the tax year ends.”
— Adam Woodhead, Senior Analyst, The Investors Centre
What is the Total Value of ISA Savings in the UK?
The total stock of UK ISA savings — the cumulative market value of all ISA accounts — reached £872 billion as of 5 April 2024. This is a 20.1% increase in a single year, driven by both record new subscriptions and investment market growth.
Of the £872 billion total, approximately £360 billion (41.3%) is held in Cash ISAs and £511 billion (58.6%) in Stocks and Shares ISAs. The share held in cash has increased each year since 2021/22 as higher rates attracted more money into cash savings products.
Year End
Total ISA Market Value
Cash ISA Value
S&S ISA Value
Cash Share
Apr 2022
~£741bn
—
—
38.4%
Apr 2023
£725.9bn (-2.1%)
~£294bn
~£431bn
40.5%
Apr 2024
£872bn (record)
~£360bn
~£511bn
41.3%
Source: HMRC Annual Savings Statistics, September 2025. gov.uk
Cash ISA vs Stocks and Shares ISA: How the Market Splits
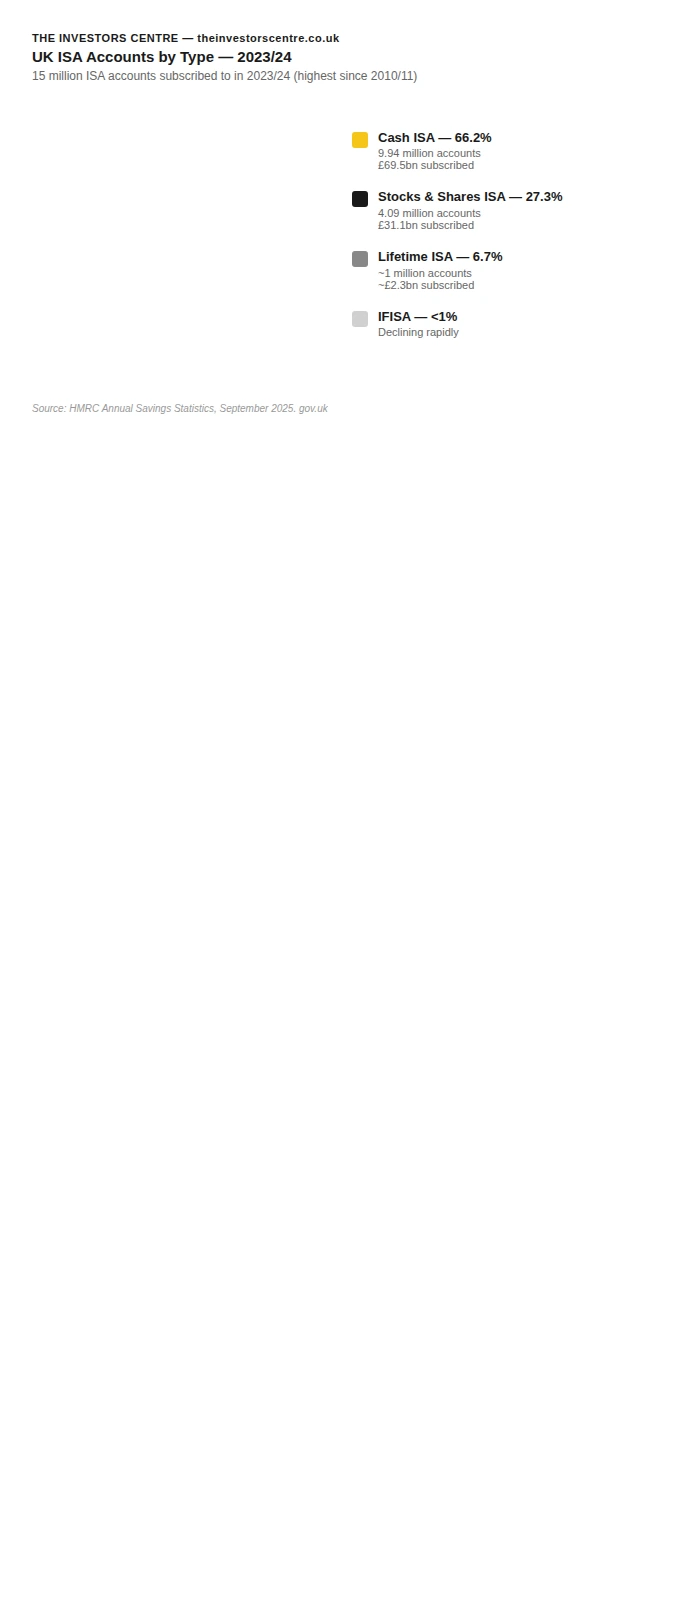
Cash ISAs account for 66.2% of all ISA accounts subscribed in 2023/24 and 67.5% of total subscription value — the highest cash share in over a decade. Stocks and Shares ISAs account for 27.3% of accounts and 30.2% of subscription value.
The choice of where to hold an ISA increasingly matters as the market bifurcates between cash and equity products. Comparing investment platforms on fees, account types and execution costs is usually the first decision for anyone opening a Stocks and Shares ISA, because platform choice compounds meaningfully over a multi-decade holding period.
ISA Type
Accounts (2023/24)
Subscriptions
Avg Subscription
Market Value (Apr 2024)
Cash ISA
9.94 million (66.2%)
£69.5bn (67.5%)
~£7,000
~£360bn
Stocks & Shares ISA
4.09 million (27.3%)
£31.1bn (30.2%)
~£7,600
~£511bn
Lifetime ISA
~1 million (6.7%)
~£2.3bn (2.2%)
~£2,300
Included in S&S
Innovative Finance ISA
Minimal (falling)
Minimal
—
Minimal
Junior ISA (adult-equiv.)
1.37 million
£1.8bn
£1,347
—
Source: HMRC Annual Savings Statistics, September 2025. gov.uk
THE INVESTORS CENTRE — theinvestorscentre.co.uk
UK ISA Accounts by Type — 2023/24
15 million ISA accounts subscribed to in 2023/24 (highest since 2010/11)
Who Has an ISA? Ownership by Age, Gender, and Income
ISA ownership in the UK is heavily skewed towards older, wealthier adults. The rate at which different demographic groups hold Cash ISAs spans from 10% among 18–24 year olds to 48% among 65–74 year olds — a nearly five-fold gap across age groups.
Cash ISA ownership by age (2024)
Age Group
% Holding Cash ISA (2024)
Change from 2022
18–24
10%
+1pp (not significant)
25–34
20%
0pp
35–44
29%
+2pp
45–54
33%
+6pp (significant)
55–64
39%
+5pp (significant)
65–74
48%
+7pp (significant)
75+
46%
+8pp (significant)
Source: FCA Financial Lives 2024 (fieldwork Feb–Jun 2024; 17,950 respondents). Published May 2025. fca.org.uk
Cash ISA ownership by income (2024)
Household Income
% Holding Cash ISA (2024)
Change from 2022
Under £15,000
19%
+1pp
£15,000–£29,999
30%
+1pp
£30,000–£49,999
35%
+3pp
£50,000+
40%
+7pp (significant)
Source: FCA Financial Lives 2024. fca.org.uk
Cash ISA ownership by ethnicity (2024)
Ethnicity
% Holding Cash ISA (2024)
Change from 2022
White
35%
+5pp (significant)
Black and Black British
22%
+3pp
Asian and Asian British
22%
+2pp
Mixed/multiple ethnicity
20%
-2pp (not significant)
Source: FCA Financial Lives 2024. fca.org.uk
Cash ISA ownership by housing tenure (2024)
Housing Tenure
% Holding Cash ISA (2024)
Change from 2022
Own outright
54%
+9pp (significant)
Mortgage
36%
+5pp (significant)
Renting
16%
+2pp
Source: FCA Financial Lives 2024. fca.org.uk
What the ISA Data Tells Us About UK Saving Behaviour
Three patterns in the UK ISA data stand out as particularly significant:
1. The cash bias is entrenched and growing. 61% of UK adults with savings of £10,000 or more hold all or most of it in cash (FCA Financial Lives 2024). This figure has risen from 55% in 2020 despite compelling evidence that equity investments outperform over the long term.
2. Younger adults are not engaging with ISAs. Only 10% of 18–24 year olds hold a Cash ISA and 17% hold any ISA. The ISA product suite — particularly the Stocks and Shares ISA — is largely invisible to younger generations, with 42% of all UK adults having no meaningful awareness of S&S ISAs (Investment Association, March 2025).
3. The ISA allowance is under-utilised. The average ISA subscriber puts in approximately £7,000 — just 35% of the £20,000 allowance. 41.9% of subscribers save less than £2,500 in a year. The full allowance is used by only 22.7% of subscribers, and disproportionately by the highest earners.
What is the Average ISA Balance in the UK?
The average ISA market value per UK ISA holder was £34,044 as of April 2023. This mean figure is heavily influenced by large balances held by older, wealthier account holders. The distribution is highly skewed: over 41% of subscribers save less than £2,500 per year.
Broken down by age, the gap is dramatic: over-65s hold an average of £64,386 while under-25s hold just £8,288 — a pattern that closely mirrors the broader distribution of average wealth by age in the UK, where accumulated assets compound steadily across working life.
Age Group
Average ISA Market Value (Apr 2023)
Relative to National Average
Under 25
£8,288
24% of average
25–34
£10,556
31% of average
35–44
Approx £20,000–£25,000
58–73%
45–54
Approx £30,000–£40,000
88–117%
55–64
Approx £50,000–£60,000
147–176%
65+
£64,386
189% of average
All ages (UK average)
£34,044
—
Source: HMRC Annual Savings Statistics, September 2025 (Tables 9.7–9.12). Intermediate age band figures derived from HMRC table distributions. gov.uk
THE INVESTORS CENTRE — theinvestorscentre.co.uk
Average UK ISA Balance by Age Group (April 2023)
ISA wealth accumulates sharply with age — over-65s hold nearly 8x more than under-25s
📌 The average ISA balance for over-65s (£64,386) is 7.8x higher than for under-25s (£8,288). The UK average across all ages is £34,044.
As of 5 April 2023, HMRC data confirmed 5,070 ISA accounts worth £1 million or more — a record high at the time and a 4.5% increase on the 4,850 recorded a year earlier. The total number of ISA millionaires has grown by over 1,000% in seven years.
The top 25 ISA investors hold an average of £11.3 million each in their ISA accounts — all returns and income completely free of UK tax.
ISA Value Band
Number of Accounts (April 2023)
Notes
£500,000–£999,999
~59,970
Near-millionaires
£1m–£1.999m
~4,800
Majority of millionaires
£2m–£2.999m
~200
£3m–£3.999m
~30
£4m+
~50
Includes top 25 at avg £11.3m
Total £1m+
5,070
Average holding: £1,346,000
Source: HMRC FOI response, reported by MoneyWeek and Plum, 2024. Primary FOI data.
TIC Analysis: The Real Cost of Not Investing in an ISA
The average UK ISA subscriber puts in £7,000 per year — just 35% of the £20,000 allowance. If that £7,000 is held in a Cash ISA earning the current average rate of 3.8%, over 10 years it grows to approximately £84,400. Invested in a FTSE All-Share tracker at the long-run average return of 7.5% annually (total return, pre-tax), the same £7,000 per year grows to approximately £100,100 — a £15,700 or 18.6% gap in favour of investment.
Over 25 years, the gap widens dramatically: Cash ISA at 3.8% produces approximately £278,000; a FTSE All-Share S&S ISA at 7.5% produces approximately £503,000 — a £225,000 or 81% advantage to the investor.
Time Period
Cash ISA at 3.8%
S&S ISA at 7.5% (FTSE All-Share avg)
Investment Advantage
10 years (£7,000/yr)
£84,400
£100,100
+£15,700 (+18.6%)
25 years (£7,000/yr)
£278,000
£503,000
+£225,000 (+81%)
40 years (£20,000/yr, full allowance)
£1.52m
£5.46m
+£3.94m (+259%)
Methodology: Using the ISA Millionaire Projection model, we calculated the projected terminal value of the full £20,000 ISA allowance invested annually from age 18, at three real-terms return scenarios, to age 65. We also calculated the ‘cash penalty’ — the wealth gap between holding the average ISA subscription (£7,000/year) in cash versus investing in a FTSE All-Share tracker, using Bank of England CPI data and FTSE All-Share total return data (1999–2025). Sources: Bank of England base rate history; ONS CPI Index; FTSE All-Share total return index 1999–2025. TIC calculation, April 2026. Past performance does not guarantee future returns. For illustrative purposes only.
ISA Allowance History: How the Limit Has Changed Since 1999
The ISA was introduced on 6 April 1999, replacing Personal Equity Plans (PEPs) and Tax-Exempt Special Savings Accounts (TESSAs). The annual subscription limit has been raised several times and has been frozen at £20,000 since 2017/18 — a period during which inflation has eroded its real value by approximately 35%.
Tax Year
ISA Annual Limit
Key Policy Change
1999/00–2007/08
£7,000
ISAs launched; £3,000 max for Cash ISAs
2009/10
£10,200 (over-50s)
Mid-year uplift for older savers
2010/11
£10,200 (all adults)
Extended to all ages
2014/15 (from Jul 2014)
£15,000
‘New ISA’ — cash/S&S distinction removed
2017/18
£20,000
Current limit set; LISA introduced (£4,000 sub-limit)
2018/19–2026/27
£20,000
Frozen for 10+ consecutive years
2027/28 (under-65s)
£12,000 Cash ISA
First ever reduction in Cash ISA limit
Sources: HMRC, HM Treasury, The Motley Fool UK ISA allowance history. gov.uk
In real terms, the £20,000 allowance introduced in 2017/18 is worth approximately £13,000 in 2017 prices by 2026, due to cumulative CPI inflation. A TIC analysis of ONS CPI data shows the allowance has lost approximately 35% of its real value since it was last raised.
TIC calculation: The £20,000 ISA limit in real 2017 terms equals approximately £13,200 at April 2026 prices (ONS CPI deflator applied). To maintain real purchasing power, the limit would need to be raised to approximately £28,000 in 2026/27. TIC calculation based on ONS CPI data, April 2026.
“A £20,000 allowance frozen for a decade isn't a neutral policy — it's a quiet real-terms cut of roughly 35%. For anyone capping their ISA out each year, the effective ceiling has dropped to £13,200 in 2017 money. To preserve the original intent of the allowance, the limit should already be above £28,000. Instead, the 2027 Cash ISA cap will reduce headline capacity further for most working-age savers.”
— Adam Woodhead, Senior Analyst, The Investors Centre
What ISA Changes Are Coming?
Two significant policy changes have been announced that will reshape the ISA landscape from 2027:
Cash ISA allowance cap (from April 2027): Under-65s will be limited to £12,000 per year in Cash ISAs, down from £20,000. The over-65s exemption was introduced following Parliamentary pressure. The overall £20,000 ISA limit is unchanged — under-65s must put at least £8,000 into a Stocks and Shares ISA, LISA, or IFISA to use their full allowance. Source: Autumn Budget 2025, HM Treasury.
LISA replacement (from April 2028): The Lifetime ISA will be replaced by a simpler first-time buyer ISA. The retirement savings element will be discontinued. Existing LISA holders may continue contributing to their current LISA. Consultation is expected in early 2026. Source: Parliament UK Treasury Committee LISA Report, 2025.
“The April 2027 Cash ISA cap is the first reduction in any adult ISA limit since the product launched in 1999 — and it's more significant than it looks. Under-65s saving the full allowance will be forced to decide on investment exposure, not just opt into it. For the Treasury, that's the whole point: it's an investment-first policy dressed as a cash cap. Platform choice becomes the decision most UK savers have avoided for 25 years.”
— Adam Woodhead, Senior Analyst, The Investors Centre
Frequently Asked Questions
How many ISAs are there in the UK?
Approximately 21.3 million UK adults held an ISA as of 2022/23, with 15 million actively subscribing during 2023/24 — the highest annual subscriber count since 2010/11. Source: HMRC Annual Savings Statistics, September 2025.
How much money is in ISAs in the UK?
The total value of all UK ISA savings reached £872 billion as of April 2024 — a record high representing a 20% increase in a single year. Of this, approximately £360 billion is in Cash ISAs and £511 billion in Stocks and Shares ISAs. Source: HMRC Annual Savings Statistics, September 2025.
How much is put into ISAs each year?
£103 billion was subscribed into adult ISAs during 2023/24 — a record and a 44% increase on the prior year. The average individual ISA subscription was approximately £7,000 — 35% of the £20,000 annual allowance. Source: HMRC Annual Savings Statistics, September 2025.
What percentage of UK adults have an ISA?
Approximately 39.4% of adults in England hold an ISA of any type. Broken down by product: 32% of UK adults hold a Cash ISA and 17% hold a Stocks and Shares ISA (some hold both). Source: HMRC Annual Savings Statistics 2025; FCA Financial Lives 2024.
What is the average ISA balance in the UK?
The average ISA market value per holder was £34,044 as of April 2023. This mean figure is skewed by high balances among older savers: over-65s average £64,386 versus £8,288 for under-25s. Source: HMRC Annual Savings Statistics, September 2025.
How many ISA millionaires are there in the UK?
As of April 2023, 5,070 ISA accounts held over £1 million, holding an average of £1.35 million. The top 25 ISA investors average £11.3 million per account. A further approximately 60,000 people hold ISAs worth between £500,000 and £999,999. Source: HMRC FOI response, 2024.
Which is more popular — Cash ISA or Stocks and Shares ISA?
Cash ISAs are significantly more popular. In 2023/24, 9.94 million accounts subscribed to Cash ISAs (66.2% of all ISA accounts) versus 4.09 million subscribing to Stocks and Shares ISAs (27.3%). Cash ISA subscriptions also exceeded S&S ISA subscriptions in value (£69.5bn vs £31.1bn). Source: HMRC Annual Savings Statistics, September 2025.
What is the ISA allowance for 2025/26?
The ISA allowance for the 2025/26 tax year is £20,000 per adult. The Lifetime ISA sub-limit is £4,000 (included within the £20,000). The Junior ISA limit is £9,000 separately. The adult allowance has been frozen at £20,000 since 2017/18. Source: GOV.UK.
Is the ISA allowance changing?
Yes. From April 2027, the Cash ISA allowance will be reduced to £12,000 per year for under-65s (down from £20,000). The overall £20,000 ISA limit is unchanged. From April 2028, the Lifetime ISA is expected to be replaced by a new first-time buyer ISA product. Source: HM Treasury, Autumn Budget 2025; Treasury Committee LISA Report, 2025.
What is the ISA allowance history?
ISAs launched in 1999 with a £7,000 limit. This rose to £10,200 in 2010/11, then to £15,000 in 2014/15 under the ‘New ISA’ reforms, then to the current £20,000 in 2017/18. The allowance has not changed since — a freeze of at least 10 consecutive years through to 2027/28. Source: HMRC; HM Treasury.
Why did Cash ISA subscriptions surge?
The Bank of England raised the base rate from 0.1% in December 2021 to a peak of 5.25% by August 2023. This made cash savings materially attractive for the first time in over a decade, triggering a wave of money into Cash ISAs. Cash ISA subscriptions rose 67% in 2023/24 alone. Source: Bank of England; HMRC Annual Savings Statistics 2025.
Can I pay into multiple ISAs in the same tax year?
Yes — since April 2024, UK adults can pay into multiple ISAs of the same type with different providers in the same tax year. Previously, only one ISA of each type per year was permitted. Partial transfers between providers are also now allowed. Source: The Individual Savings Account (Amendment) Regulations 2024 (SI 2024/350).
What is a Lifetime ISA and how many people have one?
A Lifetime ISA (LISA) allows adults aged 18–39 to save up to £4,000 per year and receive a 25% government bonus. Approximately 3.7% of UK adults held a LISA in 2024 (around 2 million people). The LISA is expected to be replaced by a first-time buyer ISA from April 2028. Source: FCA Financial Lives 2024; Treasury Committee Report, 2025.
Do young people use ISAs?
Young adults significantly under-use ISAs. Only 10% of 18–24 year olds hold a Cash ISA and approximately 11% hold a Lifetime ISA (primarily to save for a first home). Stocks and Shares ISA uptake among under-25s is very low. The Investment Association found that 42% of all UK adults have no meaningful awareness of Stocks and Shares ISAs. Source: FCA Financial Lives 2024; Investment Association, March 2025.
What is the Junior ISA limit and how popular are JISAs?
The Junior ISA limit is £9,000 per tax year. In 2023/24, 1.37 million Junior ISA accounts received subscriptions totalling £1.8 billion — an average of £1,347 per account. 63.6% of JISA money went into Stocks and Shares JISAs, with the remainder into Cash JISAs. Source: HMRC Annual Savings Statistics, September 2025.
Using This Data
All statistics on this page are sourced from official UK datasets including HMRC Annual Savings Statistics, FCA Financial Lives Survey 2024, HM Treasury, the Bank of England, and the Investment Association. Proprietary analysis is clearly labelled as TIC calculations. This ISA dataset sits within our wider library of UK financial and investment statistics pages covering pensions, wealth, retail trading and savings behaviour.

