


Asset rich, cash poor: the short version
You are asset rich and cash poor when most of your net worth sits in a house you live in and cannot spend. A paid-off home pays you nothing each month. There are only four ways to turn it into money — sell it, shrink it, let part of it, or borrow against it — and each one costs something. The cheapest fix is the one you make twenty years early, by building a pot outside the house while the house does its own thing.
What does asset rich, cash poor actually mean?
It means your balance sheet looks healthy and your bank account does not. On paper you are worth a few hundred thousand pounds. In practice you are counting the heating bill, because the asset doing all the work is the roof over your head, and a roof does not pay a monthly income.
This is not a fringe problem in the UK, and it is not the same thing as being badly off. It is a liquidity problem. The wealth is real. It is simply locked in the one asset you cannot sell a piece of, cannot spend, and cannot stop living in.
It also tends to arrive quietly. Nobody decides to become asset rich and cash poor. You buy a house, you pay the mortgage off, prices do what prices have done, and by the time you stop working the house has become the portfolio — not by plan, but by default.
How much UK wealth is locked up in houses?
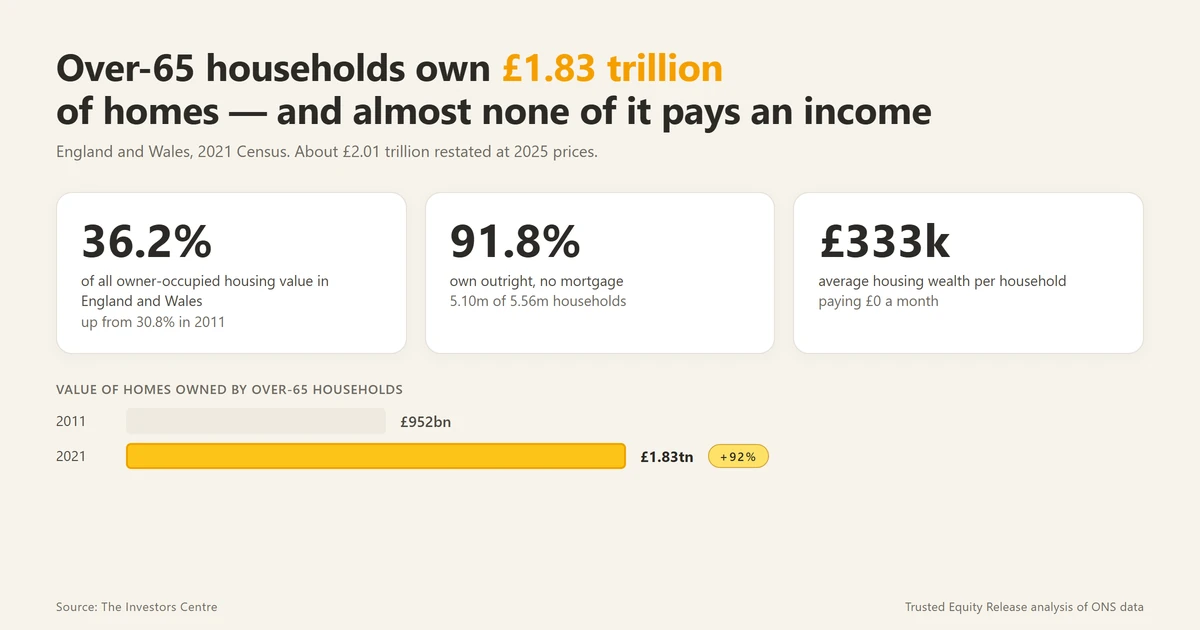
Enough that it shapes the whole retirement picture. Households in England and Wales headed by someone aged 65 or over owned homes worth an estimated £1.83 trillion at the 2021 Census — about £2.01 trillion if you restate the same homes at year-ending-December-2025 prices.
The detail matters more than the headline:
- 36.2% of all owner-occupied housing value in England and Wales belonged to over-65 households in 2021, up from 30.8% in 2011.
- 91.8% of them owned outright — no mortgage, no loan. That is 5.10 million of 5.56 million households.
- That works out at an average of about £333,000 of housing wealth per household, across 5.51 million owner households.
- The total rose 92% in a decade, from £952 billion in 2011. Roughly 69% of the increase came from higher prices rather than more older owners.
So the typical over-65 owner household holds a third of a million pounds in bricks, owes nothing on it, and receives from it exactly £0 a month. Meanwhile the full new State Pension is £241.30 a week, which is £12,547.60 a year.
If you want the wider context on how net worth builds and peaks across a working life, we have broken the age bands down in our guide to the average net worth by age in the UK.
Why does this keep happening?
Because UK house prices have done something remarkable for a very long time, and because paying a mortgage feels like saving when it is really two things at once.
On the Nationwide index, the average UK house cost £1,891 in the final quarter of 1952. In the second quarter of 2026 it was £278,784. That is roughly 7% a year for over seven decades, capital only.
Two things follow from that. The first is that anybody who bought a house and simply stayed put has done well, with no skill required. The second is the trap: every extra pound of that gain is a pound you cannot access without doing something drastic, because you are living inside the asset.
A share portfolio worth £333,000 can be sold in thirds. A house cannot. You cannot sell the second bedroom and keep the kitchen. That indivisibility is the whole problem, and it is why housing wealth and retirement income are not the same thing even when the numbers look identical.
There is also a quieter effect. Because the house is rising in value, it feels like the retirement plan is working — so the pension contribution never gets increased and the ISA never gets opened. The paper wealth crowds out the cash-generating wealth. That is worth understanding properly, and our piece on the best compound interest investments in the UK covers the mechanism the house does not give you.
How do you turn housing wealth into income?
There are four routes and a fifth choice, which is to do nothing. None of them is free, and the right one depends entirely on whether you want to keep living there.
1. Sell and buy something smaller
The most complete answer. You convert the gap between the two prices into money you actually hold, and you cut the running costs at the same time. It also means moving, which for a lot of people is the objection that ends the conversation. We have costed what the move actually frees up, and what comes off the top, in a separate piece on downsizing to fund retirement.
2. Let a room
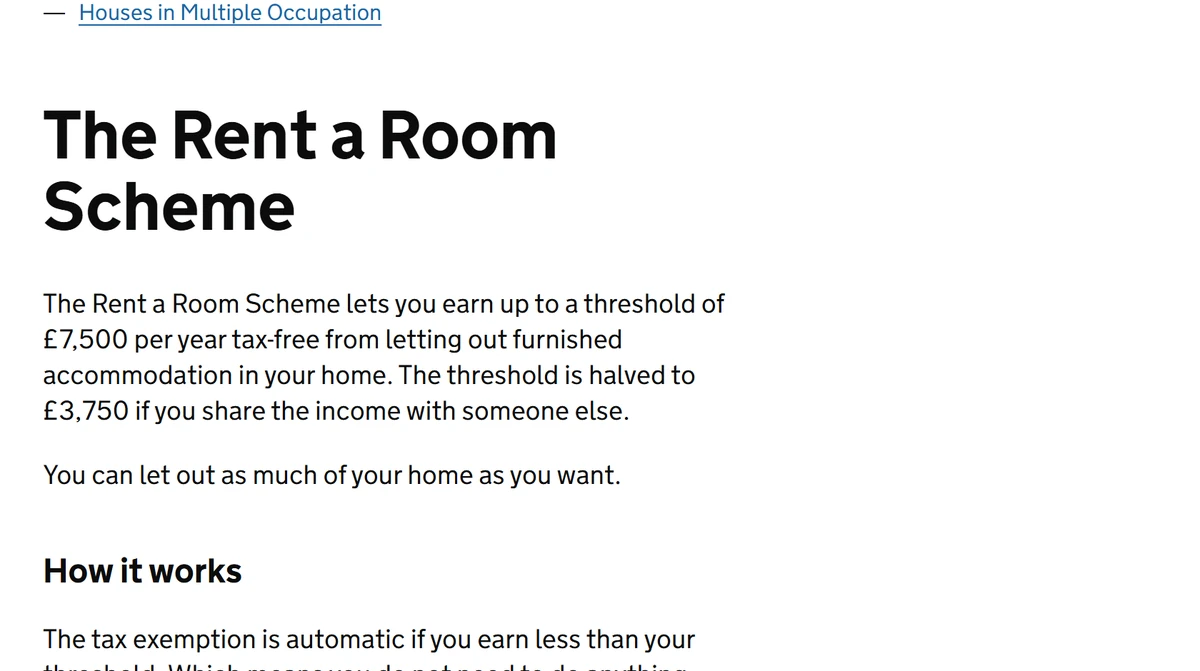
The most overlooked answer, because the tax treatment is unusually generous. Under the Rent a Room Scheme you can earn £7,500 a year tax free from letting furnished accommodation in your own home — £3,750 each if you share the income with someone else. That is £625 a month, tax free, which is roughly 60% of the full new State Pension, without selling anything or moving anywhere.
3. Borrow against it
A later-life mortgage or retirement interest-only deal lets you take money out while staying put, and you keep paying interest. The debt does not compound away out of sight, but you do need the income to service it — which, for someone who is cash poor, is precisely the difficulty.
4. Release equity
A lifetime mortgage lets you take a lump sum or drawdown with no monthly payments, and the interest rolls up until the house is sold. It solves the cash problem without a move, and it is the most expensive of the four over a long horizon, because unpaid interest compounds against you rather than for you. It is a regulated product and it needs specialist advice: equity release is not a decision to make from an article, ours included.
5. Do nothing
A legitimate choice, and the most common one. Doing nothing keeps the house intact for whoever inherits it and keeps your costs and complications at zero. It also means the £333,000 stays at £0 a month for as long as you need income, which is the cost nobody puts on the list.
The maths that stops it happening in the first place
Every option above is damage control. The thing that actually prevents the problem is boring: a pot outside the house, built slowly, in a wrapper that does not tax the growth. The ISA allowance is £20,000 a year, which is far more headroom than most people use.
Here is what regular monthly saving into a stocks and shares ISA produces. The two rates are illustrative, not promises, and they are deliberately anchored to things we have measured rather than picked: 4% a year is close to the median 10-year return on UK house prices, and 6% a year is close to the median 10-year return on global equities including dividends.
| Monthly amount | Years | You pay in | Value at 4% a year | Value at 6% a year |
|---|---|---|---|---|
| £250 | 10 | £30,000 | £36,674 | £40,618 |
| £250 | 20 | £60,000 | £90,960 | £113,360 |
| £250 | 30 | £90,000 | £171,318 | £243,628 |
| £500 | 10 | £60,000 | £73,348 | £81,237 |
| £500 | 20 | £120,000 | £181,921 | £226,719 |
| £500 | 30 | £180,000 | £342,635 | £487,256 |
Contributions are assumed at the end of each month, with the annual rate converted to a monthly equivalent. No charges are deducted, and investment returns are not guaranteed — the point of the table is the shape, not the decimal places.
The shape is the argument. £500 a month for thirty years is £180,000 of your own money and, at 6%, roughly £487,000 in the account. That is the same order of magnitude as the average over-65 household's housing wealth — except this version can be sold in slices, drawn down monthly, and does not require you to move house or borrow against your own front door.
£500 a month is £6,000 a year, well inside the £20,000 allowance. Even £250 a month uses only £3,000 of it.
What should you actually do about it?
It depends how much runway is left, and the honest answer changes completely between the two cases.
If retirement is fifteen years away or more
You have the easy version of this problem. Stop treating the mortgage as the savings plan. Open or fund the ISA, take whatever employer pension match is on the table, and let the house appreciate in the background as a place to live rather than as the plan. Fifteen years is long enough for the table above to do real work.
If you are at or near retirement
The ISA table is no longer the answer, because compounding needs time you do not have. This is where the four routes matter, and where the order matters: letting a room is the cheapest and most reversible, downsizing is the most complete, borrowing is the most flexible, and releasing equity is the most expensive but the least disruptive. Price all four before ruling any of them in.
Either way, the question worth asking first is whether the house was ever a pension in the first place. We have taken that one apart properly, using rolling return windows rather than a single flattering start date, in is my house my pension?
Frequently asked questions
Is being asset rich and cash poor the same as being wealthy?
On a balance sheet, yes. In a month, no. Wealth measures what you own; cash flow measures what arrives. Someone with £333,000 of housing equity and the State Pension has roughly £1,046 a month coming in, whatever the valuation says.
How much housing wealth do older UK households actually hold?
An estimated £1.83 trillion in England and Wales at the 2021 Census for households headed by someone 65 or over, or about £2.01 trillion restating the same homes at 2025 prices. That is 36.2% of all owner-occupied housing value, and 91.8% of those households owned outright.
Is releasing equity better than downsizing?
They solve different problems. Downsizing converts the value permanently and cuts your running costs, at the price of moving. Equity release leaves you in the house and charges compounding interest for the privilege. Over a long retirement the second is usually the more expensive of the two, which is the trade you are making for staying put.
Can I rent out a room without paying tax on it?
Up to £7,500 a year, yes, under the Rent a Room Scheme, if you are letting furnished accommodation in the home you live in. It halves to £3,750 if the income is shared with someone else. Above the threshold you report the income in the normal way.
How much should I be putting outside the house?
That depends on your income, your timeline and what the house is for, and it is not something an article can answer for you. What the table above shows is the cost of the delay rather than the right number: at 6% a year, starting ten years later roughly halves the outcome for the same monthly amount.
Sources
- Trusted Equity Release — Over-65s housing wealth statistics, England and Wales, analysis of ONS data, 2021 Census, restated at year-ending-December-2025 prices. Figures checked 28 September 2026.
- Nationwide House Price Index — UK house prices since 1952, full quarterly series. Average UK price £278,784 in Q2 2026.
- GOV.UK — The new State Pension: what you'll get. £241.30 a week, checked 28 September 2026.
- GOV.UK — The Rent a Room Scheme. Threshold £7,500 a year tax free, halved to £3,750 where the income is shared. Checked 29 September 2026.
- GOV.UK — Individual Savings Accounts. £20,000 annual allowance, checked 28 September 2026.
- Office for National Statistics — Income and wealth, household wealth by age.
This article is general information about how housing wealth and retirement income interact. It is not advice on equity release, downsizing, pensions or investments, and it is not a recommendation to use any product or provider. Equity release and later-life lending are regulated products; take specialist advice before acting.