- expertise:
- CFD Trading, Forex, Derivatives, Risk Management
- credentials:
- Chartered ACII (2018) · Trading since 2012
- tested:
- 40+ forex & CFD platforms with live accounts

- expertise:
- Platform Testing, Cryptocurrency, Retail Investing
- credentials:
- Active investor since 2013 · 11+ years experience
- tested:
- 50+ platforms · 200+ guides authored

- expertise:
- Broker Comparison, ISA Strategy, Portfolio Management
- credentials:
- Active investor since 2013 · 11+ years experience
- tested:
- 40+ brokers with funded accounts

- expertise:
- CFD Trading, Forex, Derivatives, Risk Management
- credentials:
- Chartered ACII (2018) · Trading since 2012
- tested:
- 40+ forex & CFD platforms with live accounts

- expertise:
- Platform Testing, Cryptocurrency, Retail Investing
- credentials:
- Active investor since 2013 · 11+ years experience
- tested:
- 50+ platforms · 200+ guides authored

- expertise:
- Broker Comparison, ISA Strategy, Portfolio Management
- credentials:
- Active investor since 2013 · 11+ years experience
- tested:
- 40+ brokers with funded accounts
How We Test
Real accounts. Real money. Real trades. No demo accounts or press releases.
What we measure:
- Spreads vs advertised rates
- Execution speed and slippage
- Hidden fees (overnight, withdrawal, conversion)
- Actual withdrawal times
Scoring:
Fees (25%) · Platform (20%) · Assets (15%) · Mobile (15%) · Tools (10%) · Support (10%) · Regulation (5%)
Regulatory checks:
FCA Register verification · FSCS protection
Testing team:
Adam Woodhead (investing since 2013), Thomas Drury (Chartered ACII, 2018), Dom Farnell (investing since 2013) — 50+ platforms with funded accounts
Quarterly reviews · Corrections: [email protected]
Disclaimer
Not financial advice. Educational content only. We're not FCA authorised. Consult a qualified advisor before investing.
Capital at risk. Investments can fall. Past performance doesn't guarantee future results.
CFD warning. 67-84% of retail accounts lose money trading CFDs. High risk due to leverage.
Contact: [email protected]
Introduction
The UK has always been a nation with significant wealth, but the landscape for millionaires today is more diverse and widespread than ever before. Understanding the number of millionaires in the UK provides important insights into wealth distribution, economic health, and financial opportunities across the country.
In this article, we’ll discuss the number of millionaires in the UK, including how this compares to the number of millionaires in other countries, and how this has changed over time.
Key statistics
- There are 3,061,553 millionaires in the UK as of the latest estimates from 2023, and this is expected to decrease to 2,542,464 by 2028.
- Globally, the UK ranks third on the list of countries with the most millionaires, behind the U.S. (21,951,319) and China (6,013,282).
- An estimated 4.48% of people in the UK are millionaires, while Switzerland has the highest proportion of millionaires at 11.91% of the population.
- The UK is expected to see the largest percentage decrease (-17%) in resident millionaires between 2023 and 2028, with only the Netherlands also expecting a decrease (-4%).
- London is home to an estimated 227,000 millionaires as of 2025, alongside 4,750 Ultra-High-Net-Worth individuals, and 36 billionaires.
- An estimated 9,500 liquid millionaires left the UK in 2024 – the second-highest net outflow globally (after China with 15,200).
- There are 55 billionaires in the UK as of 2025 (equating to 0.814 billionaires per million people), and the UK ranks 10th globally for the number of billionaires.
- HMRC estimates that wealthy individuals (earning £200,000 or more, or with assets worth £2 million or more) paid a total of £119 billion in taxes in 2023-24.
What defines a millionaire?
A millionaire in the UK is generally defined as someone whose net worth (total assets minus liabilities) is equal to or more than £1 million GBP or the equivalent in another currency, depending on the metric being used. Someone might fluctuate in and out of the millionaire category if the value of their assets or liabilities goes up or down.
There are different ways that people can be defined as millionaires in the UK, depending on whether someone is classified as a total millionaire or a liquid millionaire.
Total millionaires
A total millionaire is someone whose total net worth is at least £1 million. Total net worth is determined by adding up a person’s assets, such as cash, property, pension funds, and investments, and subtracting all debts, such as mortgages, loans, and credit card balances.
Liquid millionaires
A liquid millionaire is someone who has over £1 million in cash and/or liquid investible assets like stocks or mutual funds. This doesn’t include non-liquid assets like properties, vehicles, or antiques.
The number of millionaires in the UK
The latest estimates as of 2023 put the number of millionaires in the UK at 3,061,553, and this is projected to decrease to 2,542,464 by 2028. When breaking these figures down by population, this equates to 4.48% of people in the UK being millionaires in 2023. [1] [2]
UK millionaires by region
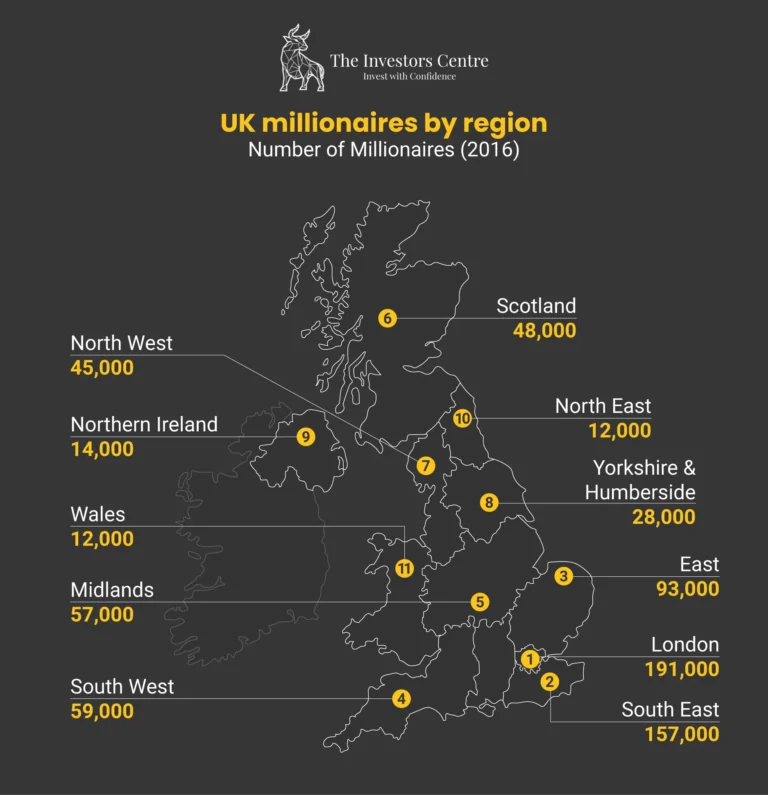
The most recent estimates on where millionaires reside in the UK are based on data from 2016. This data suggested that, perhaps unsurprisingly, the highest proportion of UK millionaires lived in London (191,000), followed by the South East (157,000), and the East of England (93,000). Wales and the North East of England were estimated to have the fewest resident millionaires at the time of this research, both with 12,000.
London
When looking at London specifically, 2025 data from Savory & Partners estimates that there are 227,000 millionaires residing in London. Alongside this, London is also home to 4,750 Ultra-High-Net-Worth (UHNW) individuals worth $30 million or more, and 36 billionaires. The top 1% in terms of net worth have an average net worth of £14.2 million, and overall wages have seen an increase of 3.8% between 2024 and 2025. [4]
Number of millionaires by country
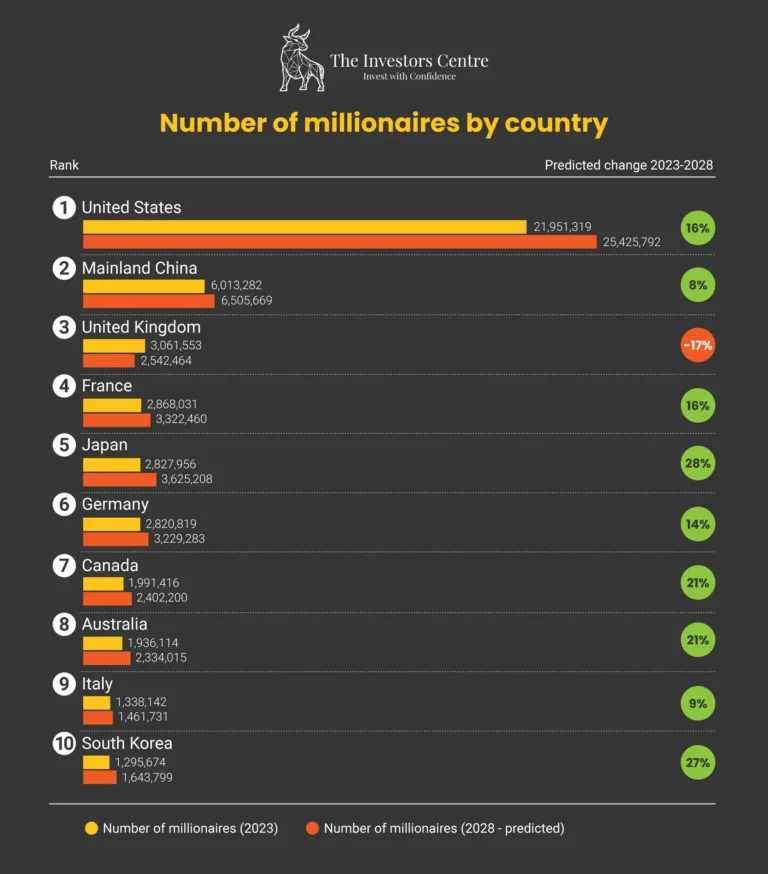
As of 2023, the latest data shows that the U.S. currently has the most millionaires, with a total of 21,951,319, and this is expected to grow by 16% to over 25 million by 2028. This is followed by mainland China, with 6,013,282 millionaires and a predicted 8% rise by 2028.
The UK is third on the list with 3,061,553 millionaires as of 2023; however, the number of millionaires in the UK is predicted to fall by 17% to 2,542,464 by 2028. The only other country on the list where the number of millionaires is expected to fall during this period is the Netherlands (-4%).
Taiwan is expected to see the largest rise in the number of millionaires, with a predicted increase of 47% from 788,799 in 2023 to 1,158,239 in 2028.
| Rank | Country | Number of millionaires (2023) | Number of millionaires (2028 - predicted) | Predicted Change 2023–2028 |
|---|---|---|---|---|
| 1 | United States | 21,951,319 | 25,425,792 | 16% |
| 2 | Mainland China | 6,013,282 | 6,505,669 | 8% |
| 3 | United Kingdom | 3,061,553 | 2,542,464 | -17% |
| 4 | France | 2,868,031 | 3,322,460 | 16% |
| 5 | Japan | 2,827,956 | 3,625,208 | 28% |
| 6 | Germany | 2,820,819 | 3,229,283 | 14% |
| 7 | Canada | 1,991,416 | 2,402,200 | 21% |
| 8 | Australia | 1,936,114 | 2,334,015 | 21% |
| 9 | Italy | 1,338,142 | 1,461,731 | 9% |
| 10 | South Korea | 1,295,674 | 1,643,799 | 27% |
| 11 | Netherlands | 1,231,625 | 1,179,328 | -4% |
| 12 | Spain | 1,180,703 | 1,327,797 | 12% |
| 13 | Switzerland | 1,054,293 | 1,253,334 | 19% |
| 14 | India | 868,671 | 1,061,463 | 22% |
| 15 | Taiwan | 788,799 | 1,158,239 | 47% |
| 16 | Hong Kong SAR | 629,155 | 737,716 | 17% |
| 17 | Sweden | 575,426 | 703,216 | 22% |
| 18 | Belgium | 564,666 | 653,881 | 16% |
| 19 | Russia | 381,726 | 461,487 | 21% |
| 20 | Brazil | 380,585 | 463,797 | 22% |
| 21 | Saudi Arabia | 351,855 | 403,874 | 15% |
| 22 | Singapore | 333,204 | 375,725 | 13% |
| 23 | Mexico | 331,538 | 411,652 | 24% |
| 24 | Norway | 253,085 | 308,247 | 22% |
| 25 | United Arab Emirates | 202,201 | 232,067 | 15% |
| 26 | Israel | 179,905 | 226,226 | 26% |
| 27 | Indonesia | 178,605 | 235,136 | 32% |
| 28 | Portugal | 171,797 | 189,235 | 10% |
| 29 | Thailand | 100,001 | 123,531 | 24% |
| 30 | South Africa | 90,595 | 108,557 | 20% |
| 31 | Chile | 81,274 | 95,173 | 17% |
| 32 | Greece | 80,655 | 80,295 | 0% |
| 33 | Türkiye | 60,787 | 87,077 | 43% |
| 34 | Kazakhstan | 44,307 | 60,874 | 37% |
| 35 | Qatar | 26,163 | 29,927 | 14% |
| 36 | Hungary | 24,692 | 28,260 | 14% |
Data based on USD
Source: UBS, “Global Wealth Report”
Millionaires per capita by country
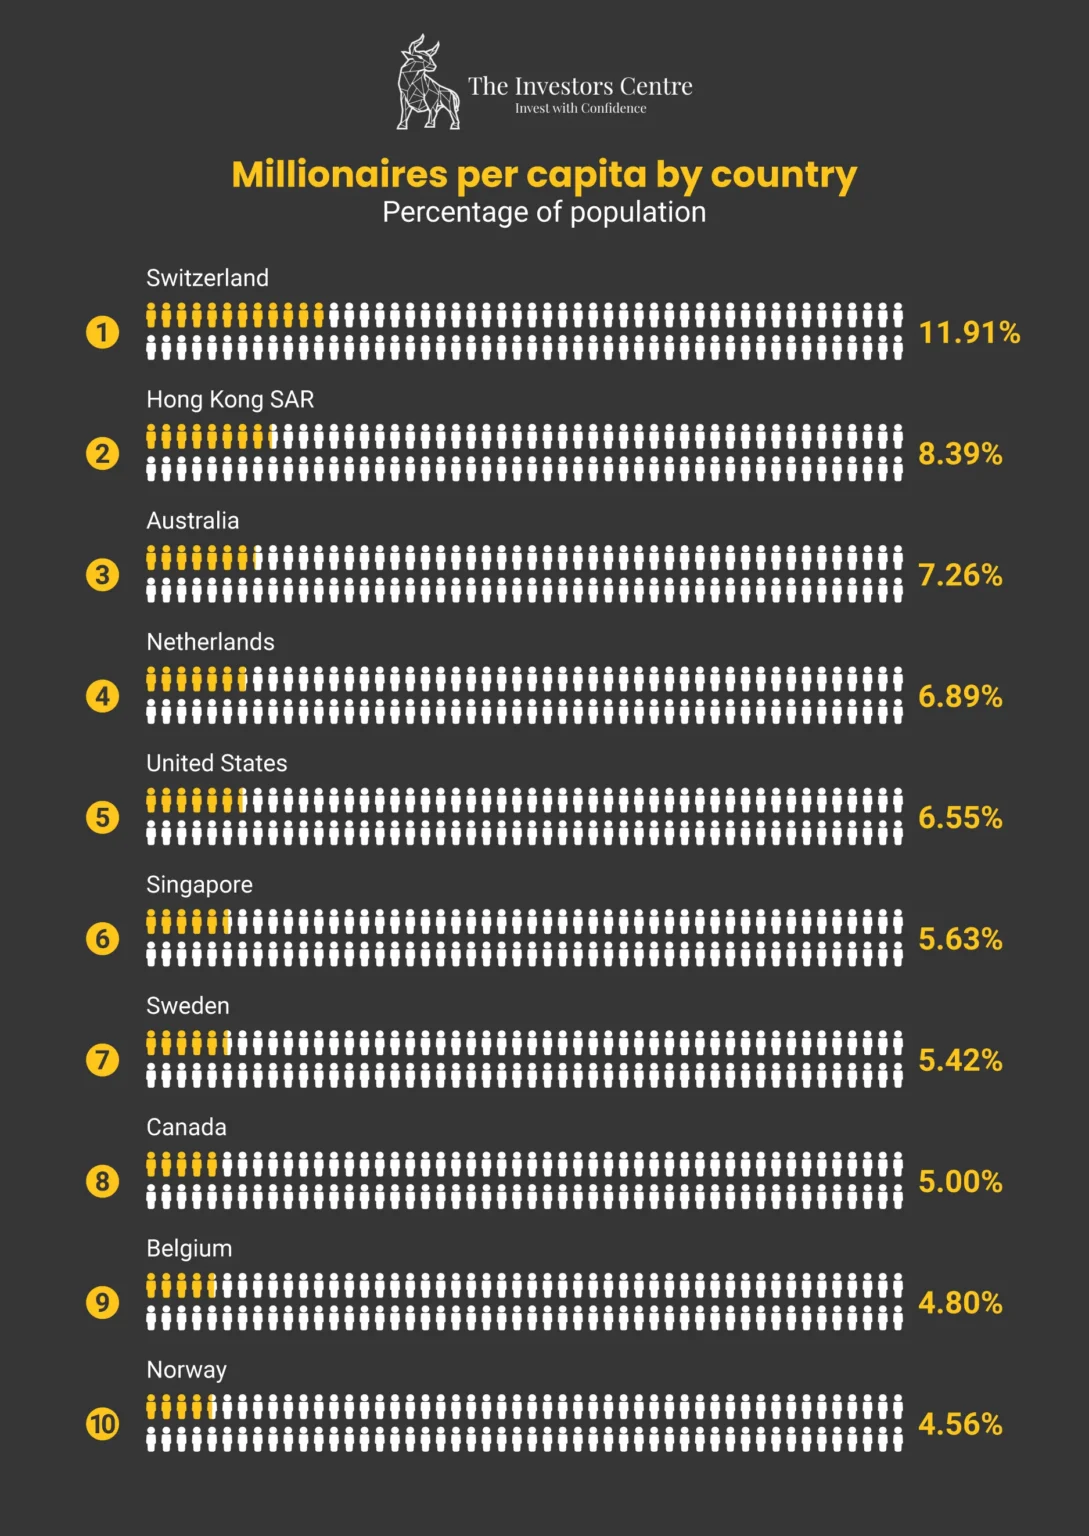
When breaking down the number of millionaires by population in each country, the UK is 11th on the list, with 4.48% of the population being millionaires; this equates to approximately one in every 22 people.
Switzerland tops the ranking of millionaires per capita, with 11.91% of its population being millionaires, or one in eight people. Despite being the second highest in terms of total millionaires, China ranks 25th for millionaires per capita, with only 0.43% of its population falling into the millionaire category.
The country with the most millionaires in total, the United States, is 5th on the per capita list, with 6.55% of its population being millionaires.
| Rank | Country | Percentage of Population |
|---|---|---|
| 1 | Switzerland | 11.91% |
| 2 | Hong Kong SAR | 8.39% |
| 3 | Australia | 7.26% |
| 4 | Netherlands | 6.89% |
| 5 | United States | 6.55% |
| 6 | Singapore | 5.63% |
| 7 | Sweden | 5.42% |
| 8 | Canada | 5.00% |
| 9 | Belgium | 4.80% |
| 10 | Norway | 4.56% |
| 11 | United Kingdom | 4.48% |
| 12 | France | 4.20% |
| 13 | Germany | 3.39% |
| 14 | Taiwan | 3.30% |
| 15 | South Korea | 2.51% |
| 16 | Spain | 2.45% |
| 17 | Japan | 2.27% |
| 18 | Italy | 2.27% |
| 19 | United Arab Emirates | 2.12% |
| 20 | Israel | 1.85% |
| 21 | Portugal | 1.63% |
| 22 | Qatar | 0.96% |
| 23 | Saudi Arabia | 0.95% |
| 24 | Greece | 0.78% |
| 25 | Mainland China | 0.43% |
| 26 | Chile | 0.41% |
| 27 | Russia | 0.27% |
| 28 | Mexico | 0.26% |
| 29 | Hungary | 0.26% |
| 30 | Kazakhstan | 0.22% |
| 31 | Brazil | 0.18% |
| 32 | South Africa | 0.15% |
| 33 | Thailand | 0.14% |
| 34 | Türkiye | 0.07% |
| 35 | Indonesia | 0.06% |
| 36 | India | 0.06% |
Sources:
- World Bank, “Populations by Country”
- UBS, “Global Wealth Report”
Millionaires leaving the UK
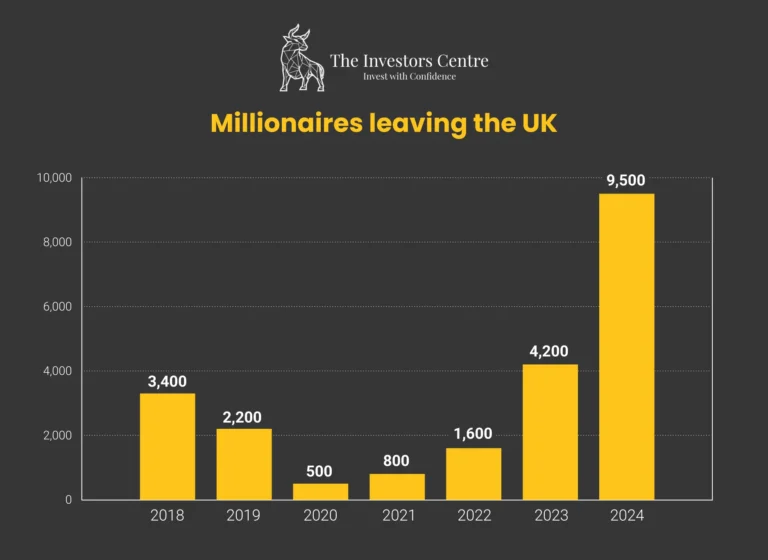
As we mentioned previously, the UK is expected to see a decrease in the number of resident millionaires, with an estimated 17% reduction between 2023 and 2028, falling from 3,061,553 to 2,542,464. This represents the largest percentage decrease in millionaires across the countries studied in a UBS report. [5]
When looking at the number of liquid millionaires leaving the UK, an estimated 9,500 of these individuals left the country in 2024, showing a growing trend that has increased year-on-year since 2020.
| Rank | Country | Percentage of Population |
|---|---|---|
| 1 | Switzerland | 11.91% |
| 2 | Hong Kong SAR | 8.39% |
| 3 | Australia | 7.26% |
| 4 | Netherlands | 6.89% |
| 5 | United States | 6.55% |
| 6 | Singapore | 5.63% |
| 7 | Sweden | 5.42% |
| 8 | Canada | 5.00% |
| 9 | Belgium | 4.80% |
| 10 | Norway | 4.56% |
| 11 | United Kingdom | 4.48% |
| 12 | France | 4.20% |
| 13 | Germany | 3.39% |
| 14 | Taiwan | 3.30% |
| 15 | South Korea | 2.51% |
| 16 | Spain | 2.45% |
| 17 | Japan | 2.27% |
| 18 | Italy | 2.27% |
| 19 | United Arab Emirates | 2.12% |
| 20 | Israel | 1.85% |
| 21 | Portugal | 1.63% |
| 22 | Qatar | 0.96% |
| 23 | Saudi Arabia | 0.95% |
| 24 | Greece | 0.78% |
| 25 | Mainland China | 0.43% |
| 26 | Chile | 0.41% |
| 27 | Russia | 0.27% |
| 28 | Mexico | 0.26% |
| 29 | Hungary | 0.26% |
| 30 | Kazakhstan | 0.22% |
| 31 | Brazil | 0.18% |
| 32 | South Africa | 0.15% |
| 33 | Thailand | 0.14% |
| 34 | Türkiye | 0.07% |
| 35 | Indonesia | 0.06% |
| 36 | India | 0.06% |
Sources:
- World Bank, “Populations by Country”
- UBS, “Global Wealth Report”
Outflows of liquid millionaires by country
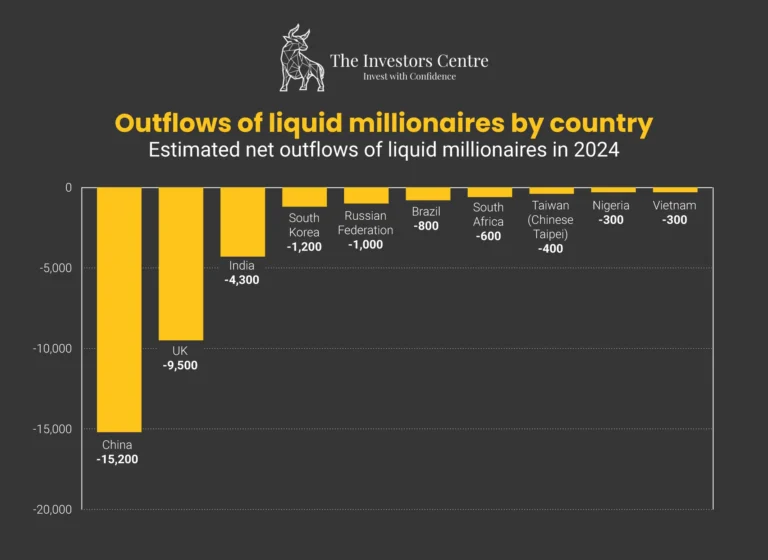
2024 data estimated that 9,500 liquid millionaires left the UK in 2024, the second-highest net outflow of the countries analyzed in this study. The country with the highest estimated outflow of liquid millionaires was China, with 15,200 expected to have left, while India was in third with an estimated outflow of 4,300.
Tax from millionaires in the UK
The total amount of tax that a millionaire will pay each year in the UK depends on several factors, including where their earnings come from and how their finances are managed.
HMRC defines a wealthy individual as someone who earns more than £200,000 per year or has assets worth more than £2 million. In the UK, there were approximately 850,000 wealthy individuals identified in 2023-24, an increase from 700,000 in 2019-20.
Tax data shows that these wealthy individuals paid £119 billion in personal taxes in total in the 2023-24 financial year.
When looking at income specifically, rather than net worth, UK Parliament data shows that in 2023-24, around 29,000 people had incomes of £1 million or more, and were liable for approximately £34 billion in income tax in total. This includes around 10,000 taxpayers with annual incomes of £2 million or more, and 5,000 with assets worth at least £50 million. [7]
UK tax rates by earnings bracket
Tax rates and brackets in the UK determine how much income tax someone will pay based on their earnings bracket. As of the 2025/2026 tax year, someone earning the personal allowance of £12,570 (or less) will pay no income tax.
At the other end of the scale, someone earning more than £125,140 per year will fall into the Additional tax bracket. Based on the UK’s progressive tax system, they would pay 20% income tax on what they earn between £12,571 and £50,270, 40% on what they earn between £50,271 to £125,140, and 45% on what they earn over £125,140.
This means someone earning £1 million or more each year would fall into the Additional tax bracket and follow the same tax rates.
| 2025/2026 UK tax rates | ||
|---|---|---|
| Bracket | Rate | |
| Personal Allowance | £0 to £12,570 | 0% |
| Basic | £12,571 to £50,270 | 20% |
| Higher | £50,271 to £125,140 | 40% |
| Additional | Over £125,140 | 45% |
Source: UK Government, “Income Tax Rates”
The number of billionaires in the UK
According to data from Forbes, there are 55 billionaires in the UK, unchanged from 2024. This puts the UK in 10th place on the list of countries with the most billionaires.
Global billionaires
Globally, there are 3,028 billionaires in 2025, an increase of 247 from 2024. This equates to 0.343 billionaires per million people worldwide.
The U.S. has the most billionaires in total, with 902, an increase compared to 813 in 2024; this equates to 2.42 billionaires per million people in the U.S.
| Rank | Country | 2024 | 2025 | Change | Billionaires per million people |
|---|---|---|---|---|---|
| World | 2,781 | 3,028 | 247 | 0.343 | |
| 1 | United States | 813 | 902 | 89 | 2.42 |
| 2 | China | 406 | 450 | 44 | 0.288 |
| 3 | India | 200 | 205 | 5 | 0.144 |
| 4 | Germany | 132 | 171 | 39 | 1.56 |
| 5 | Russia | 120 | 140 | 20 | 0.821 |
| 6 | Canada | 67 | 76 | 9 | 1.643 |
| 7 | Italy | 73 | 74 | 1 | 1.239 |
| 8 | Hong Kong | 67 | 66 | -1 | 8.936 |
| 9 | Brazil | 69 | 56 | -13 | 0.34 |
| 10 | United Kingdom | 55 | 55 | 0 | 0.814 |
| 11 | Taiwan | 51 | 54 | 3 | 2.178 |
| 12 | France | 53 | 52 | -1 | 0.775 |
| 13 | Singapore | 39 | 49 | 10 | 6.591 |
| 14 | Australia | 48 | 47 | -1 | 1.79 |
| 15 | Sweden | 43 | 45 | 2 | 4.075 |
| 16 | Switzerland | 41 | 42 | 1 | 4.591 |
| Japan | 41 | 42 | 1 | 0.331 | |
| 18 | Israel | 36 | 41 | 5 | 3.649 |
| 19 | Spain | 29 | 34 | 5 | 0.597 |
| 20 | Indonesia | 35 | 33 | -2 | 0.125 |
| 21 | Turkey | 27 | 32 | 5 | 0.316 |
| 22 | South Korea | 36 | 30 | -6 | 0.702 |
| 23 | Thailand | 26 | 25 | -1 | 0.381 |
| 24 | Mexico | 22 | 22 | 0 | 0.17 |
| 25 | Malaysia | 17 | 19 | 2 | 0.509 |
| 26 | Norway | 12 | 17 | 5 | 2.162 |
| 27 | Greece | 10 | 16 | 6 | 0.96 |
| 28 | Philippines | 16 | 15 | -1 | 0.142 |
| Saudi Arabia | 0 | 15 | 15 | - | |
| 30 | Netherlands | 14 | 13 | -1 | 0.78 |
| 31 | Czech Republic | 11 | 11 | 0 | 1.011 |
| Ireland | 11 | 11 | 0 | 2.083 | |
| Belgium | 10 | 11 | 1 | 0.847 | |
| 34 | Cyprus | 10 | 10 | 0 | 10.892 |
| Poland | 8 | 10 | 2 | 0.213 | |
| 36 | Austria | 9 | 9 | 0 | 0.983 |
| Denmark | 9 | 9 | 0 | 1.51 | |
| 38 | Finland | 7 | 7 | 0 | 1.256 |
| South Africa | 6 | 7 | 1 | 0.097 | |
| Ukraine | 5 | 7 | 2 | 0.136 | |
| 41 | Chile | 6 | 6 | 0 | 0.301 |
| Kazakhstan | 6 | 6 | 0 | 0.299 | |
| Lebanon | 6 | 6 | 0 | 1.093 | |
| Romania | 6 | 6 | 0 | 0.315 | |
| United Arab Emirates | 4 | 6 | 2 | 0.431 | |
| 46 | Vietnam | 6 | 5 | -1 | 0.06 |
| Egypt | 5 | 5 | 0 | 0.048 | |
| Argentina | 5 | 5 | 0 | 0.107 | |
| New Zealand | 4 | 5 | 1 | 0.754 | |
| 50 | Hungary | 5 | 4 | -1 | 0.521 |
| Colombia | 4 | 4 | 0 | 0.076 | |
| Nigeria | 4 | 4 | 0 | 0.018 | |
| 53 | Morocco | 2 | 3 | 1 | 0.054 |
| 54 | Monaco | 3 | 2 | -1 | 76.825 |
| Bulgaria | 2 | 2 | 0 | 0.31 | |
| Qatar | 2 | 2 | 0 | 0.753 | |
| Oman | 2 | 2 | 0 | 0.391 | |
| Slovakia | 2 | 2 | 0 | 0.369 | |
| Georgia | 2 | 2 | 0 | 0.535 | |
| Estonia | 1 | 2 | 1 | 0.732 | |
| Nepal | 1 | 2 | 1 | 0.034 | |
| 61 | Portugal | 1 | 1 | 0 | 0.096 |
| Barbados | 1 | 1 | 0 | 3.734 | |
| Venezuela | 1 | 1 | 0 | 0.035 | |
| Algeria | 1 | 1 | 0 | 0.022 | |
| Eswatini | 1 | 1 | 0 | 0.817 | |
| Guernsey | 1 | 1 | 0 | 15.602 | |
| Iceland | 1 | 1 | 0 | 2.519 | |
| Liechtenstein | 1 | 1 | 0 | 25.174 | |
| Tanzania | 1 | 1 | 0 | 0.016 | |
| Zimbabwe | 1 | 1 | 0 | 0.066 | |
| Armenia | 1 | 1 | 0 | 0.335 | |
| Belize | 1 | 1 | 0 | 2.265 | |
| Croatia | 1 | 1 | 0 | 0.259 | |
| Luxembourg | 1 | 1 | 0 | 1.513 | |
| Albania | 0 | 1 | 1 | - | |
| - | Uruguay | 2 | 0 | -2 | 0.581 |
| St. Kitts & Nevis | 1 | 0 | -1 | 21.189 | |
| Bangladesh | 1 | 0 | -1 | 0.006 | |
| Panama | 1 | 0 | -1 | 0.246 |
Source: Forbes, “2025 Billionaires List”
References
- Adam Smith, “Millionaire Tracker”
- World Bank, “Populations by Country”
- Statista, “Where the UK’s Millionaires Reside”
- Savory and Partners, “London’s Millionaires: Wealth Statistics”
- UBS, “Global Wealth Report”
- Henley Global, “Henley Private Wealth Migration Dashboard”
- UK Parliament, “Collecting the Right Tax From Wealthy Individuals”
- UK Government, “Income Tax Rates”
- Forbes, “2025 Billionaires List”

